Target 2006 Annual Report Download - page 34
Download and view the complete annual report
Please find page 34 of the 2006 Target annual report below. You can navigate through the pages in the report by either clicking on the pages listed below, or by using the keyword search tool below to find specific information within the annual report.-
 1
1 -
2
-
3
-
4
-
5
-
6
-
7
-
8
-
9
-
10
-
11
-
12
-
13
-
14
-
15
-
16
-
17
-
18
-
19
-
20
-
21
-
22
-
23
-
 24
24 -
 25
25 -
 26
26 -
 27
27 -
 28
28 -
 29
29 -
 30
30 -
 31
31 -
 32
32 -
 33
33 -
 34
34 -
 35
35 -
 36
36 -
 37
37 -
 38
38 -
 39
39 -
 40
40 -
 41
41 -
 42
42 -
 43
43 -
 44
44 -
45
-
46
-
47
-
48
-
49
-
50
-
51
-
52
-
53
-
54
-
55
-
56
-
57
-
58
-
59
-
60
-
61
-
62
-
63
-
64
-
65
-
66
-
67
-
68
-
69
-
70
-
71
-
72
-
73
-
74
-
75
-
76
 |
 |

share repurchase program, we have repurchased a total of 71.0 million shares of our common stock for a
total investment of $3,450 million ($48.56 per share). Of the shares reacquired in 2006, a portion was
delivered upon settlement of prepaid forward contracts. The details of prepaid forward contract settlements
and our long positions in prepaid forward contracts have been provided in Note 25 and Note 27. In 2005
we reacquired 23.1 million shares for a total investment of $1,197 million ($51.88 per share). We expect to
continue to execute our share repurchase program primarily in open market transactions, subject to market
conditions, and to complete the total program by year-end 2008 or sooner.
Our financing strategy is to ensure liquidity and access to capital markets, to manage our net exposure
to floating interest rate volatility and to maintain a balanced spectrum of debt maturities. Within these
parameters, we seek to minimize our cost of borrowing.
In 2006 we declared dividends of $.46 per share totaling approximately $396 million, an increase of
18.6 percent over 2005. In 2005 we declared dividends of $.38 per share totaling approximately
$334 million, an increase of 19.3 percent over 2004. We have paid dividends every quarter since our first
dividend was declared following our 1967 initial public offering, and it is our intent to continue to do so in
the future.
Management believes that cash flows from operations, together with current levels of cash and cash
equivalents, proceeds from long-term financing activities and issuance of short-term debt will be sufficient in
2007 to fund planned capital expenditures, share repurchases, growth in receivables, maturities of
long-term debt, and other cash requirements, including our seasonal inventory buildup.
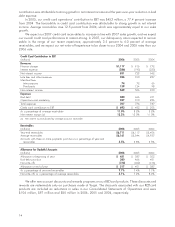
Maintaining strong investment-grade debt ratings is a key part of our strategy. Our debt ratings as of
February 3, 2007 were:
Debt Ratings
Standard and
Moody’s Poor’s Fitch
Long-term debt A1 A+ A+
Commercial paper P-1 A-1 F1
Securitized receivables Aaa AAA n/a
As described in Note 19, during 2006 we issued $750 million of long-term debt and issued
$500 million of Variable Funding Certificates backed by credit card receivables through the Target Credit
Card Master Trust. As of February 3, 2007, $100 million of the Variable Funding Certificates were
outstanding. Further liquidity is provided by a committed $1.6 billion unsecured revolving credit facility
obtained through a group of banks in June 2005, which is scheduled to expire in June 2010. No balances
were outstanding at any time during 2006 or 2005 under this or previously existing revolving credit facilities.
Most of our long-term debt obligations contain covenants related to secured debt levels. In addition, our
credit facility contains a debt leverage covenant. We are, and expect to remain, in compliance with these
covenants. At February 3, 2007, no notes or debentures contained provisions requiring acceleration of
payment upon a debt rating downgrade.
Our interest coverage ratio represents the ratio of pre-tax earnings before fixed charges (interest
expense and the interest portion of rent expense) to fixed charges. Our interest coverage ratio calculated as
prescribed by Securities and Exchange Commission (SEC) rules was 7.1x, 7.2x, and 5.4x in 2006, 2005
and 2004, respectively. The ratio in 2004 was adversely affected by losses from discretionary debt
repurchase transactions and excludes historical income from discontinued operations. Management
believes adjustments for these items are necessary to make the coverage ratio a more useful and consistent
indicator of creditworthiness.
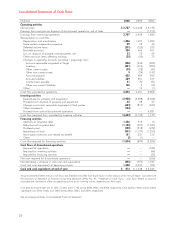
Capital Expenditures
Capital expenditures were $3,928 million in 2006 compared to $3,388 million in 2005 and
$3,068 million in 2004. This increase was primarily attributable to continued new store expansion, an
increase in remodel program expenditures and growth in distribution center capital investment. Net
property and equipment increased $2,393 in 2006 following an increase of $2,178 million in 2005.
16