Target 2006 Annual Report Download - page 30
Download and view the complete annual report
Please find page 30 of the 2006 Target annual report below. You can navigate through the pages in the report by either clicking on the pages listed below, or by using the keyword search tool below to find specific information within the annual report.-
 1
1 -
2
-
3
-
4
-
5
-
6
-
7
-
8
-
9
-
10
-
11
-
12
-
13
-
14
-
15
-
16
-
17
-
18
-
19
-
 20
20 -
 21
21 -
 22
22 -
 23
23 -
 24
24 -
 25
25 -
 26
26 -
 27
27 -
 28
28 -
 29
29 -
 30
30 -
 31
31 -
 32
32 -
 33
33 -
 34
34 -
 35
35 -
 36
36 -
 37
37 -
 38
38 -
 39
39 -
 40
40 -
41
-
42
-
43
-
44
-
45
-
46
-
47
-
48
-
49
-
50
-
51
-
52
-
53
-
54
-
55
-
56
-
57
-
58
-
59
-
60
-
61
-
62
-
63
-
64
-
65
-
66
-
67
-
68
-
69
-
70
-
71
-
72
-
73
-
74
-
75
-
76
 |
 |

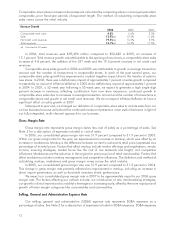
Comparable-store sales increases or decreases are calculated by comparing sales in current year periods to
comparable, prior fiscal-year periods of equivalent length. The method of calculating comparable-store
sales varies across the retail industry.
Revenue Growth
2006 2005 2004
Comparable-store sales 4.8% 5.6% 5.3%
Sales 12.9%(a) 12.2% 11.6%
Net credit card revenues 19.5%(a) 16.5% 5.5%
Total revenues 13.1%(a) 12.3% 11.5%
(a) Consisted of 53 weeks.
In 2006, total revenues were $59,490 million compared to $52,620 in 2005, an increase of
13.1 percent. Total revenue growth was attributable to the opening of new stores, a comparable-store sales
increase of 4.8 percent, the addition of the 53rd week and the 19.5 percent increase in net credit card
revenues.
Comparable-store sales growth in 2006 and 2005 was attributable to growth in average transaction
amount and the number of transactions in comparable stores. In each of the past several years, our
comparable-store sales growth has experienced a modest negative impact due to the transfer of sales to
new stores. In 2006, there was a deflationary impact of approximately 1 percent on sales growth compared
to essentially no impact of inflation/deflation in 2005 and a deflationary impact of approximately 1 percent
in 2004. In 2007, a 52-week year following a 53-week year, we expect to generate a high single-digit
percent increase in revenues, reflecting contribution from new store expansion, continued growth in
comparable-store sales due to increases in average transaction amount and the number of transactions in
comparable stores and growth in net credit card revenues. We do not expect inflation/deflation to have a
significant effect on sales growth in 2007.
Subsequent to year end, we changed our definition of comparable-store sales to include sales from our
on-line business because we believe this combined measure represents a more useful disclosure in light of
our fully-integrated, multi-channel approach to our business.
Gross Margin Rate
Gross margin rate represents gross margin (sales less cost of sales) as a percentage of sales. See
Note 3 for a description of expenses included in cost of sales.
In 2006, our consolidated gross margin rate was 31.9 percent compared to 31.9 percent in 2005.
Within our gross margin rate for the year, we experienced an increase in markup, which was offset by an
increase in markdowns. Markup is the difference between an item’s cost and its retail price (expressed as a
percentage of its retail price). Factors that affect markup include vendor offerings and negotiations, vendor
income, sourcing strategies, market forces like the cost of raw materials and freight, and competitive
influences. Markdowns are the reduction in the original or previous price of retail merchandise. Factors that
affect markdowns include inventory management and competitive influences. The definition and method of
calculating markup, markdowns and gross margin varies across the retail industry.
In 2005, our consolidated gross margin rate was 31.9 percent compared to 31.2 percent in 2004.
This change in gross margin rate primarily reflected an improvement in markup, including an increase in
direct import penetration, as well as favorable inventory shrink performance.
We expect our consolidated gross margin rate in 2007 to be approximately equal to our 2006 gross
margin rate. The factors affecting our outlook include: our introduction of new merchandising strategies,
our growth in direct imports and our ability to leverage our increasing scale, offset by the more rapid pace of
growth of lower margin categories like consumables and commodities.
Selling, General and Administrative Expense Rate
Our selling, general and administrative (SG&A) expense rate represents SG&A expenses as a
percentage of sales. See Note 3 for a description of expenses included in SG&A expenses. SG&A expenses
12