Target 2006 Annual Report Download - page 50
Download and view the complete annual report
Please find page 50 of the 2006 Target annual report below. You can navigate through the pages in the report by either clicking on the pages listed below, or by using the keyword search tool below to find specific information within the annual report.-
 1
1 -
2
-
3
-
4
-
5
-
6
-
7
-
8
-
9
-
10
-
11
-
12
-
13
-
14
-
15
-
16
-
17
-
18
-
19
-
20
-
21
-
22
-
23
-
24
-
25
-
26
-
27
-
28
-
29
-
30
-
31
-
32
-
33
-
34
-
35
-
36
-
37
-
38
-
39
-
 40
40 -
 41
41 -
 42
42 -
 43
43 -
 44
44 -
 45
45 -
 46
46 -
 47
47 -
 48
48 -
 49
49 -
 50
50 -
 51
51 -
 52
52 -
 53
53 -
 54
54 -
 55
55 -
 56
56 -
 57
57 -
 58
58 -
 59
59 -
 60
60 -
61
-
62
-
63
-
64
-
65
-
66
-
67
-
68
-
69
-
70
-
71
-
72
-
73
-
74
-
75
-
76
 |
 |
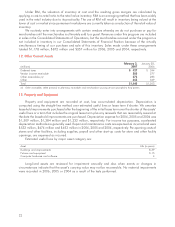
Under RIM, the valuation of inventory at cost and the resulting gross margins are calculated by
applying a cost-to-retail ratio to the retail value inventory. RIM is an averaging method that has been widely
used in the retail industry due to its practicality. The use of RIM will result in inventory being valued at the
lower of cost or market since permanent markdowns are currently taken as a reduction of the retail value of
inventory.
We routinely enter into arrangements with certain vendors whereby we do not purchase or pay for
merchandise until the merchandise is ultimately sold to a guest. Revenues under this program are included
in sales in the Consolidated Statements of Operations, but the merchandise received under the program is
not included in inventory in our Consolidated Statements of Financial Position because of the virtually
simultaneous timing of our purchase and sale of this inventory. Sales made under these arrangements
totaled $1,178 million, $872 million and $357 million for 2006, 2005 and 2004, respectively.
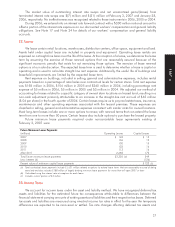
12. Other Current Assets
February 3, January 28,
(millions) 2007 2006
Deferred taxes $ 427 $ 344
Vendor income receivable 285 277
Other receivables (a) 278 283
Other 455 349
Total $1,445 $1,253
(a) Other receivables relate primarily to pharmacy receivables and merchandise sourcing services provided to third parties.
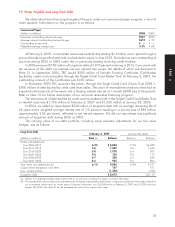
13. Property and Equipment
Property and equipment are recorded at cost, less accumulated depreciation. Depreciation is
computed using the straight-line method over estimated useful lives or lease term if shorter. We amortize
leasehold improvements purchased after the beginning of the initial lease term over the shorter of the assets’
useful lives or a term that includes the original lease term plus any renewals that are reasonably assured at
the date the leasehold improvements are purchased. Depreciation expense for 2006, 2005 and 2004 was
$1,509 million, $1,384 million and $1,232 million, respectively. For income tax purposes, accelerated
depreciation methods are generally used. Repair and maintenance costs are expensed as incurred and were
$532 million, $474 million and $453 million in 2006, 2005 and 2004, respectively. Pre-opening costs of
stores and other facilities, including supplies, payroll and other start-up costs for store and other facility
openings, are expensed as incurred.
Estimated useful lives by major asset category are:
Asset Life (in years)
Buildings and improvements 8-39
Fixtures and equipment 3-15
Computer hardware and software 4
Long-lived assets are reviewed for impairment annually and also when events or changes in
circumstances indicate that the asset’s carrying value may not be recoverable. No material impairments
were recorded in 2006, 2005 or 2004 as a result of the tests performed.
32