Target 2006 Annual Report Download - page 32
Download and view the complete annual report
Please find page 32 of the 2006 Target annual report below. You can navigate through the pages in the report by either clicking on the pages listed below, or by using the keyword search tool below to find specific information within the annual report.-
 1
1 -
2
-
3
-
4
-
5
-
6
-
7
-
8
-
9
-
10
-
11
-
12
-
13
-
14
-
15
-
16
-
17
-
18
-
19
-
20
-
21
-
 22
22 -
 23
23 -
 24
24 -
 25
25 -
 26
26 -
 27
27 -
 28
28 -
 29
29 -
 30
30 -
 31
31 -
 32
32 -
 33
33 -
 34
34 -
 35
35 -
 36
36 -
 37
37 -
 38
38 -
 39
39 -
 40
40 -
 41
41 -
 42
42 -
43
-
44
-
45
-
46
-
47
-
48
-
49
-
50
-
51
-
52
-
53
-
54
-
55
-
56
-
57
-
58
-
59
-
60
-
61
-
62
-
63
-
64
-
65
-
66
-
67
-
68
-
69
-
70
-
71
-
72
-
73
-
74
-
75
-
76
 |
 |

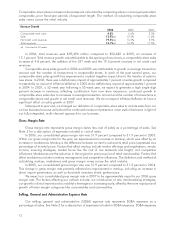
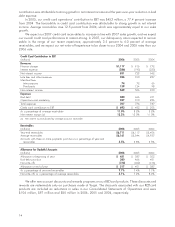
contribution was attributable to strong growth in net interest income and the year-over-year reduction in bad
debt expense.
In 2005, our credit card operations’ contribution to EBT was $452 million, a 77.4 percent increase
from 2004. The favorability in credit card contribution was attributable to strong growth in net interest
income. Average receivables rose 12.5 percent from 2004, which was approximately equal to our sales
growth.
We expect our 2007 credit card receivables to increase in line with 2007 sales growth, and we expect
our overall credit card performance to remain strong. In 2007, our delinquency rate is expected to remain
stable in the range of our recent experience, approximately 3.5 percent to 4.0 percent of average
receivables, and we expect our net write-off experience to be closer to our 2004 and 2005 rates than our
2006 rate.
Credit Card Contribution to EBT
(millions) 2006 2005 2004
Revenues
Finance charges $1,117 $ 915 $ 772
Interest expense (286) (193) (230)
Net interest income 831 722 542
Late fees and other revenues 356 310 287
Merchant fees
Intracompany 74 72 65
Third-party 139 124 98
Non-interest income 569 506 450
Expenses
Bad debt 380 466 451
Operations and marketing 327 310 286
Total expenses 707 776 737
Credit card contribution to EBT $ 693 $ 452 $ 255
As a percentage of average receivables 11.0% 8.2% 5.2%
Net interest margin (a) 13.2% 13.0% 11.0%
(a) Net interest income divided by average accounts receivable.
Receivables
(millions) 2006 2005 2004
Year-end receivables $6,711 $6,117 $5,456
Average receivables $6,161 $5,544 $4,927
Accounts with three or more payments past due as a percentage of year-end
receivables 3.5% 2.8% 3.5%
Allowance for Doubtful Accounts
(millions) 2006 2005 2004
Allowance at beginning of year $ 451 $ 387 $ 352
Bad debt provision 380 466 451
Net write-offs (314) (402) (416)
Allowance at end of year $ 517 $ 451 $ 387
As a percentage of year-end receivables 7.7% 7.4% 7.1%
Net write-offs as a percentage of average receivables 5.1% 7.2% 8.4%
We offer new account discounts and rewards programs on our REDcard products. These discounts and
rewards are redeemable only on purchases made at Target. The discounts associated with our REDcard
products are included as reductions in sales in our Consolidated Statements of Operations and were
$104 million, $97 million and $80 million in 2006, 2005 and 2004, respectively.
14