Target 2006 Annual Report Download - page 73
Download and view the complete annual report
Please find page 73 of the 2006 Target annual report below. You can navigate through the pages in the report by either clicking on the pages listed below, or by using the keyword search tool below to find specific information within the annual report.-
 1
1 -
2
-
3
-
4
-
5
-
6
-
7
-
8
-
9
-
10
-
11
-
12
-
13
-
14
-
15
-
16
-
17
-
18
-
19
-
20
-
21
-
22
-
23
-
24
-
25
-
26
-
27
-
28
-
29
-
30
-
31
-
32
-
33
-
34
-
35
-
36
-
37
-
38
-
39
-
40
-
41
-
42
-
43
-
44
-
45
-
46
-
47
-
48
-
49
-
50
-
51
-
52
-
53
-
54
-
55
-
56
-
57
-
58
-
59
-
60
-
61
-
62
-
 63
63 -
 64
64 -
 65
65 -
 66
66 -
 67
67 -
 68
68 -
 69
69 -
 70
70 -
 71
71 -
 72
72 -
 73
73 -
 74
74 -
 75
75 -
 76
76
 |
 |

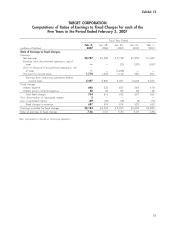
Exhibit 12
TARGET CORPORATION
Computations of Ratios of Earnings to Fixed Charges for each of the
Five Years in the Period Ended February 3, 2007
Fiscal Year Ended
Feb. 3, Jan. 28, Jan. 29, Jan. 31, Feb. 1,
(millions of dollars) 2007 2006 2005 2004 2003
Ratio of Earnings to Fixed Charges:
Earnings:
Net earnings $2,787 $2,408 $ 3,198 $1,809 $1,623
Earnings from discontinued operations, net of
taxes —— (75) (190) (247)
Gain on disposal of discontinued operations, net
of taxes —— (1,238) — —
Provision for income taxes 1,710 1,452 1,146 984 851
Earnings from continuing operations before
income taxes 4,497 3,860 3,031 2,603 2,227
Fixed charges:
Interest expense 646 532 607 569 618
Interest portion of rental expense 88 84 85 68 48
Total fixed charges 734 616 692 637 666
Plus: Amortization of capitalized interest 2————
Less: Capitalized interest (49) (42) (18) (8) (13)
Fixed charges in earnings 687 574 674 629 653
Earnings available for fixed charges $5,184 $4,434 $ 3,705 $3,232 $2,880
Ratio of earnings to fixed charges 7.06 7.21 5.35 5.07 4.33
Note: Computation is based on continuing operations.
55