Yahoo 2003 Annual Report Download - page 32
Download and view the complete annual report
Please find page 32 of the 2003 Yahoo annual report below. You can navigate through the pages in the report by either clicking on the pages listed below, or by using the keyword search tool below to find specific information within the annual report.-
 1
1 -
2
-
3
-
4
-
5
-
6
-
7
-
8
-
9
-
10
-
11
-
12
-
13
-
14
-
15
-
16
-
17
-
18
-
19
-
20
-
21
-
 22
22 -
 23
23 -
 24
24 -
 25
25 -
 26
26 -
 27
27 -
 28
28 -
 29
29 -
 30
30 -
 31
31 -
 32
32 -
 33
33 -
 34
34 -
 35
35 -
 36
36 -
 37
37 -
 38
38 -
 39
39 -
 40
40 -
 41
41 -
 42
42 -
43
-
44
-
45
-
46
-
47
-
48
-
49
-
50
-
51
-
52
-
53
-
54
-
55
-
56
-
57
-
58
-
59
-
60
-
61
-
62
-
63
-
64
-
65
-
66
-
67
-
68
-
69
-
70
-
71
-
72
-
73
-
74
-
75
-
76
-
77
-
78
-
79
-
80
-
81
-
82
-
83
-
84
-
85
-
86
-
87
-
88
-
89
-
90
-
91
-
92
-
93
-
94
 |
 |

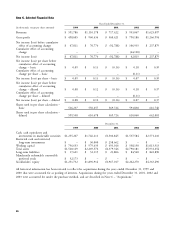
Item 6. Selected Financial Data
Years Ended December 31,
(in thousands, except per share amounts) 1999 2000 2001 2002 2003
Revenues $ 591,786 $1,110,178 $ 717,422 $ 953,067 $1,625,097
Gross profit $ 498,605 $ 960,434 $ 560,421 $ 790,186 $1,266,994
Net income (loss) before cumulative
effect of accounting change $ 47,811 $ 70,776 $ (92,788) $ 106,935 $ 237,879
Cumulative effect of accounting
change –––(64,120) –
Net income (loss) $ 47,811 $ 70,776 $ (92,788) $ 42,815 $ 237,879
Net income (loss) per share before
cumulative effect of accounting
change – basic $ 0.09 $ 0.13 $ (0.16) $ 0.18 $ 0.39
Cumulative effect of accounting
change per share – basic –––(0.11) –
Net income (loss) per share – basic $ 0.09 $ 0.13 $ (0.16) $ 0.07 $ 0.39
Net income (loss) per share before
cumulative effect of accounting
change – diluted $ 0.08 $ 0.12 $ (0.16) $ 0.18 $ 0.37
Cumulative effect of accounting
change per share – diluted –––(0.11) –
Net income (loss) per share – diluted $ 0.08 $ 0.12 $ (0.16) $ 0.07 $ 0.37
Shares used in per share calculation –
basic 516,237 550,657 569,724 593,838 616,740
Shares used in per share calculation –
diluted 599,558 610,678 569,724 610,060 642,081
December 31,
1999 2000 2001 2002 2003
Cash, cash equivalents and
investments in marketable securities $1,255,267 $1,746,211 $1,506,845 $1,537,584 $2,571,210
Restricted cash and restricted
long-term investments $ – $ 30,000 $ 258,662 $ – $ –
Working capital $ 796,653 $ 979,635 $ 693,016 $ 558,190 $1,013,913
Total assets $1,520,129 $2,269,576 $2,379,346 $2,790,181 $5,931,654
Long-term liabilities $ 17,621 $ 32,115 $ 23,806 $ 84,540 $ 822,890
Mandatorily redeemable convertible
preferred stock $ 52,173 $ – $ – $ – $ –
Stockholders’ equity $1,251,732 $1,896,914 $1,967,017 $2,262,270 $4,363,490
All historical information has been restated to reflect the acquisitions during the years ended December 31, 1999 and
2000 that were accounted for as pooling of interests. Acquisitions during the years ended December 31, 2001, 2002 and
2003 were accounted for under the purchase method, and are described in Note 6 – ‘‘Acquisitions.’’
26