Yahoo 2003 Annual Report Download - page 36
Download and view the complete annual report
Please find page 36 of the 2003 Yahoo annual report below. You can navigate through the pages in the report by either clicking on the pages listed below, or by using the keyword search tool below to find specific information within the annual report.-
 1
1 -
2
-
3
-
4
-
5
-
6
-
7
-
8
-
9
-
10
-
11
-
12
-
13
-
14
-
15
-
16
-
17
-
18
-
19
-
20
-
21
-
22
-
23
-
24
-
25
-
 26
26 -
 27
27 -
 28
28 -
 29
29 -
 30
30 -
 31
31 -
 32
32 -
 33
33 -
 34
34 -
 35
35 -
 36
36 -
 37
37 -
 38
38 -
 39
39 -
 40
40 -
 41
41 -
 42
42 -
 43
43 -
 44
44 -
 45
45 -
 46
46 -
47
-
48
-
49
-
50
-
51
-
52
-
53
-
54
-
55
-
56
-
57
-
58
-
59
-
60
-
61
-
62
-
63
-
64
-
65
-
66
-
67
-
68
-
69
-
70
-
71
-
72
-
73
-
74
-
75
-
76
-
77
-
78
-
79
-
80
-
81
-
82
-
83
-
84
-
85
-
86
-
87
-
88
-
89
-
90
-
91
-
92
-
93
-
94
 |
 |

increase in legacy volume primarily resulted from the our enterprise revenue business as a result of our reduced
addition of smaller-sized advertising units to certain of our Yahoo! Portal Solutions and Broadcast Solutions efforts
properties, which increased the number of ads per page during the year. For the year ended December 31, 2002,
and inventory available for sale, as well as from an overall fees revenue increased approximately $89 million, or
increase in total page views. The increase in legacy average 75 percent, as compared to the prior year. The increases
price per unit primarily resulted from an overall increase were attributable to an increase in the number of paying
in the price achieved for our network inventory. Market- users for our fee-based services, which were approximately
ing services revenue for the year ended December 31, 2.2 million at December 31, 2002 compared to approxi-
2002 increased by approximately $81 million, or 14 per- mately 0.4 million at December 31, 2001. Average reve-
cent as compared to the prior year. The increase was due nue per paying user per month declined from approxi-
to increased revenue of approximately $131 million real- mately $22 per user per month to approximately $7 per
ized through our worldwide pay-for-performance search user per month as a result of the introduction of new,
services and transactions revenue of approximately lower-priced consumer fee-based products, which weren’t
$38 million or 117 percent compared to the prior year. offered in the previous year, as compared with a mix
The increases were partially offset by a decrease in barter weighted toward higher priced services in 2001.
revenues of approximately $36 million, and a decrease of
Listings Revenue. For the year ended December 31, 2003,
approximately $52 million in renewals of previous adver-
listings revenue increased approximately $34 million, or
tising arrangements. The number of impressions and
36 percent, as compared to the prior year, primarily from
click-throughs delivered under advertising arrangements in
our Search & Marketplace listings. For the year ended
2002 increased by approximately 95 percent on a com-
December 31, 2002, listings revenue increased approxi-
bined basis as compared to 2001, while the average price
mately $66 million, or 242 percent, as compared to the
yield per impression and click-through delivered, also on a
prior year, approximately $65 million of which was associ-
combined basis, declined approximately 40 percent for the
ated with acquisitions completed in 2002.
same period. During the period, our focus remained on
obtaining overall advertising dollars rather than maximiz- Overall, we currently expect total combined revenues for
ing price per unit. marketing services, fees, and listings to increase in abso-
lute dollars for 2004 compared to 2003.
For the year ended December 31, 2003, over 110,000
direct and indirect customers advertised on the Yahoo!
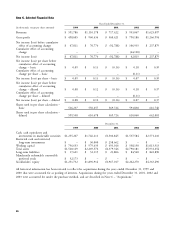
Costs and Expenses: Primary operating costs and expenses
network, compared to more than 85,000 during 2002 and were as follows (dollars in thousands):
more than 53,000 in 2001.
Years Ended December 31,
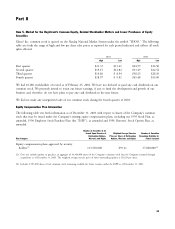
Fees Revenue. Fees revenue in 2003 increased approximately
2001 2002 2003
$90 million, or 43 percent, as compared to 2002. Approx- (1) (1) (1)
imately $100 million was associated with an increase in Cost of revenues $157,001 22% $162,881 17% $358,103 22%
the number of paying users for our fee-based services, Sales and marketing 383,854 54% 429,968 45% 530,613 33%
which were approximately 4.9 million at December 31, Product development 121,475 17% 141,766 15% 207,285 13%
2003 compared to approximately 2.2 million at Decem- General and
ber 31, 2002. Average revenue per paying user per month administrative 77,960 11% 100,676 11% 157,027 10%
declined from approximately $7 per user per month in Stock compensation
2002 to approximately $5 per user per month in 2003 as expense 9,096 1% 8,402 1% 22,029 1%
a result of faster subscriber growth in some of the lower Amortization of
priced offerings, and the introduction of lower priced intangibles 64,085 9% 21,186 2% 54,374 3%
fee-based products offered in 2003. As the volume of (1) Percent of total revenues.
users who subscribe to lower-priced products increases and
as we continue to introduce products at lower average Cost of Revenues. Cost of revenues consists of traffic acquisi-
prices, we expect the average revenue per paying user to tion costs (‘‘TAC’’) and other expenses associated with the
decrease in 2004 as compared to 2003. The increase in production and usage of the Yahoo! network.
revenues as a result of the increase in paying users was
partially offset by an approximate $11 million decline in
30