Yahoo 2003 Annual Report Download - page 61
Download and view the complete annual report
Please find page 61 of the 2003 Yahoo annual report below. You can navigate through the pages in the report by either clicking on the pages listed below, or by using the keyword search tool below to find specific information within the annual report.-
 1
1 -
2
-
3
-
4
-
5
-
6
-
7
-
8
-
9
-
10
-
11
-
12
-
13
-
14
-
15
-
16
-
17
-
18
-
19
-
20
-
21
-
22
-
23
-
24
-
25
-
26
-
27
-
28
-
29
-
30
-
31
-
32
-
33
-
34
-
35
-
36
-
37
-
38
-
39
-
40
-
41
-
42
-
43
-
44
-
45
-
46
-
47
-
48
-
49
-
50
-
 51
51 -
 52
52 -
 53
53 -
 54
54 -
 55
55 -
 56
56 -
 57
57 -
 58
58 -
 59
59 -
 60
60 -
 61
61 -
 62
62 -
 63
63 -
 64
64 -
 65
65 -
 66
66 -
 67
67 -
 68
68 -
 69
69 -
 70
70 -
 71
71 -
72
-
73
-
74
-
75
-
76
-
77
-
78
-
79
-
80
-
81
-
82
-
83
-
84
-
85
-
86
-
87
-
88
-
89
-
90
-
91
-
92
-
93
-
94
 |
 |

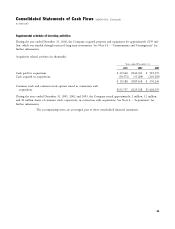
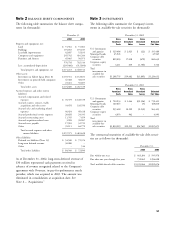
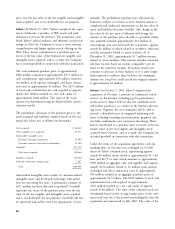
Investment gains (losses), net include realized investment Potential common shares consist of the incremental com-
gains, realized investment losses, realized and unrealized mon shares issuable upon the exercise of stock options
gains on derivatives and impairment charges related to and warrants (using the treasury stock method). For 2001,
declines in values of publicly traded securities and securi- potential common shares of approximately 27 million
ties of privately held companies judged to be other than shares were not included in the computation because they
temporary. were antidilutive. For 2002 and 2003, potential common
shares of 16 million and 25 million, respectively, were
Investment losses in 2001 were approximately $27 mil- included in the computation and were related to shares
lion, of which approximately $13 million related to issuable upon the exercise of stock options. For the year
investment impairments on publicly traded securities and ended December 31, 2003, approximately 18 million
$25 million related to investment impairments on pri- common shares issuable under the terms of the zero cou-
vately held securities, offset by a gain of $5 million related pon senior convertible notes that the Company issued in
to the sale of certain equity investments and approxi- April 2003 have not been included in potential common
mately $5 million of gains on derivatives related to equity shares as the conversion of the notes is subject to certain
instruments of other companies. Investment gains were contingencies that were not met as of December 31,
approximately $9 million in 2002, offset by impairment 2003. See Note 10 – ‘‘Long-Term Debt’’ for additional
charges on privately held securities of $6 million. Invest- information related to the zero coupon senior convertible
ment losses in 2003 included approximately $8 million notes.
related to investment impairments on privately held secu-
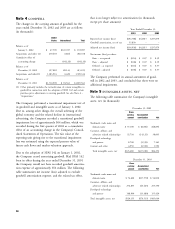
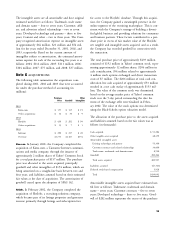
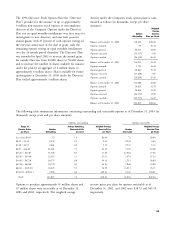
rities, offset by gains of approximately $7 million related Stock-Based Compensation. The Company measures compensa-
to the sale of certain equity investments. tion expense for its stock-based employee compensation
plans using the intrinsic value method. If the fair value
Income Taxes. Deferred income taxes are determined based based method had been applied in measuring stock com-
on the differences between the financial reporting and tax pensation expense, the pro forma effect on net income
basis of assets and liabilities and are measured using the (loss) and net income (loss) per share would have been as
currently enacted tax rates and laws. The provision for follows (in thousands, except per share amounts):
income taxes comprises the Company’s current tax liability
and change in deferred tax assets and liabilities. A valua- Years Ended December 31,
tion allowance is provided for the amount of deferred tax 2001 2002 2003
assets that, based on available evidence, are not expected Net income (loss):
to be realized. As reported $ (92,788) $ 42,815 $ 237,879
Add: Stock compensation expense
Foreign Currency. The functional currency of the Company’s included in reported net income
international subsidiaries is the local currency. The finan- (loss), net of related tax effects 9,096 5,041 12,987
cial statements of these subsidiaries are translated to Less: Stock compensation expense
United States dollars using period-end rates of exchange determined under fair value based
for assets and liabilities, and average rates of exchange for method for all awards, net of
the year for revenues and expenses. Translation gains related tax effects (899,503) (487,959) (216,025)
(losses) are recorded in accumulated other comprehensive
Pro forma net income (loss) $(983,195) $(440,103) $ 34,841
income (loss) as a component of stockholders’ equity. Net
gains and losses resulting from foreign exchange transac- Net income (loss) per share:
tions are included in other income, net and were not As reported – basic $ (0.16) $ 0.07 $ 0.39
significant during the periods presented. Pro forma – basic $ (1.73) $ (0.74) $ 0.06
As reported – diluted $ (0.16) $ 0.07 $ 0.37
Basic and Diluted Net Income (Loss) per Share. Basic net income Pro forma – diluted $ (1.73) $ (0.74) $ 0.05
(loss) per share is computed using the weighted average
number of common shares outstanding during the period. Diluted and pro forma diluted net loss per share for the
Diluted net income (loss) per share is computed using the year ended December 31, 2001 is computed excluding
weighted average number of common and, if dilutive, potential common shares of 27 million shares, as their
potential common shares outstanding during the period. effect is anti-dilutive. Pro forma diluted net loss per share
55