Yahoo 2003 Annual Report Download - page 35
Download and view the complete annual report
Please find page 35 of the 2003 Yahoo annual report below. You can navigate through the pages in the report by either clicking on the pages listed below, or by using the keyword search tool below to find specific information within the annual report.-
 1
1 -
2
-
3
-
4
-
5
-
6
-
7
-
8
-
9
-
10
-
11
-
12
-
13
-
14
-
15
-
16
-
17
-
18
-
19
-
20
-
21
-
22
-
23
-
24
-
 25
25 -
 26
26 -
 27
27 -
 28
28 -
 29
29 -
 30
30 -
 31
31 -
 32
32 -
 33
33 -
 34
34 -
 35
35 -
 36
36 -
 37
37 -
 38
38 -
 39
39 -
 40
40 -
 41
41 -
 42
42 -
 43
43 -
 44
44 -
 45
45 -
46
-
47
-
48
-
49
-
50
-
51
-
52
-
53
-
54
-
55
-
56
-
57
-
58
-
59
-
60
-
61
-
62
-
63
-
64
-
65
-
66
-
67
-
68
-
69
-
70
-
71
-
72
-
73
-
74
-
75
-
76
-
77
-
78
-
79
-
80
-
81
-
82
-
83
-
84
-
85
-
86
-
87
-
88
-
89
-
90
-
91
-
92
-
93
-
94
 |
 |

the payment to affiliates. This revenue is reported gross on the specific content or service purchased by the cus-
primarily due to the fact that we are the primary obligor tomer. These services are optional and renewable annually
to the customers of the pay-for-performance search at fixed renewal rates. Maintenance is generally sold under
services. annual contracts with fixed renewal rates. Maintenance
revenue is recognized ratably over the contract period.
Periodically, we engage in barter transactions for market- Yahoo! Portal Solutions revenues have represented less
ing services. Barter revenue is recognized over the periods than 10 percent of total revenues in all periods presented.
in which we complete our obligations under the arrange-
ment. We recognize barter revenue in accordance with Listings revenue consists of revenues generated from a
Emerging Issues Task Force No. 99-17 (‘‘EITF 99-17’’), variety of consumer and business listings-based services,
‘‘Accounting for Advertising Barter Transactions,’’ which including access to the HotJobs database and classifieds,
requires advertising barter transactions to be valued based such as Yahoo! Autos, Yahoo! Real Estate and other search
on similar cash transactions that have occurred within six services. Revenues are recognized in the month in which
months prior to the barter transaction, and also Account- the services are performed, provided that no significant
ing Principles Board No. 29 (‘‘APB 29’’) ‘‘Accounting for obligations remain and collection of the resulting receiva-
Nonmonetary Transactions,’’ which requires nonmonetary ble is reasonably assured.
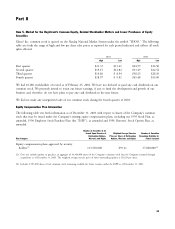
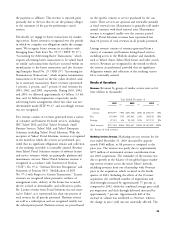
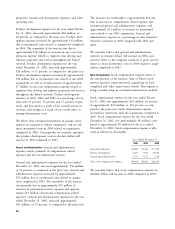
transactions to be based on the fair values involved, simi- Results of Operations
lar to monetary transactions. Barter revenues represented
1 percent, 2 percent, and 7 percent of total revenues for Revenues. Revenues by groups of similar service were as fol-
2003, 2002, and 2001, respectively. During 2003, 2002, lows (dollars in thousands):
and 2001, we delivered approximately 4.3 billion, 3.5 bil-
lion, and 1.6 billion impressions, respectively, under Years Ended December 31,
advertising barter arrangements where fair value was not 2001 2002 2003
(1) (1) (1)
determinable under EITF 99-17, and accordingly revenue
Marketing
was not recognized.
services $570,977 79% $651,568 68% $1,199,733 74%
Fees 119,090 17% 207,941 22% 298,192 18%
Fees revenue consists of revenues generated from a variety
Listings 27,355 4% 93,558 10% 127,172 8%
of consumer and business fee-based services, including
SBC Yahoo! DSL and Dial, Yahoo! Personals, Small Total revenues $717,422 100% $953,067 100% $1,625,097 100%
Business Services, Yahoo! Mail, and Yahoo! Enterprise (1) Percent of total revenues.
Solutions, including Yahoo! Portal Solutions. With the
exception of Yahoo! Portal Solutions, revenue is recognized Marketing Services Revenue. Marketing services revenue for the
in the month in which the services are performed, pro- year ended December 31, 2003 increased by approxi-
vided that no significant obligations remain and collection mately $548 million, or 84 percent as compared to the
of the resulting receivable is reasonably assured. Revenue prior year. The increase was partly due to approximately
from Yahoo! Portal Solutions consists of software license $279 million of incremental revenue contribution from
and service revenues, which are principally platform and our 2003 acquisitions. The remainder of the increase was
maintenance services. Yahoo! Portal Solutions revenue is due to growth in the balance of our global legacy market-
recognized in accordance with Statement of Position ing services revenue across the entire Yahoo! network,
(‘‘SOP’’) No. 97-2, ‘‘Software Revenue Recognition’’ and including revenues from our relationship with Overture
Statement of Position 98-9, ‘‘Modification of SOP prior to the acquisition, which occurred in the fourth
No. 97-2 with Respect to Certain Transactions.’’ License quarter of 2003. Including the effects of the Overture
revenues are recognized when persuasive evidence of acquisition, the combined number of impressions and
arrangement exists, delivery of the license has occurred, click-throughs increased by approximately 75 percent as
the fee is fixed or determinable, and collection is proba- compared to 2002, while the combined average price yield
ble. License revenue from Portal Solutions was not mate- per impression and click-through delivered increased by
rial to Yahoo!, as it represented less than one percent of approximately 7 percent. Approximately half of the
total revenue for all periods presented. Platform services increase in volume was attributed to Overture, whereas
are sold as a subscription and are recognized ratably over the change in price yield was not materially affected. The
the subscription period. Platform services are priced based
29