Yahoo 2003 Annual Report Download - page 71
Download and view the complete annual report
Please find page 71 of the 2003 Yahoo annual report below. You can navigate through the pages in the report by either clicking on the pages listed below, or by using the keyword search tool below to find specific information within the annual report.-
 1
1 -
2
-
3
-
4
-
5
-
6
-
7
-
8
-
9
-
10
-
11
-
12
-
13
-
14
-
15
-
16
-
17
-
18
-
19
-
20
-
21
-
22
-
23
-
24
-
25
-
26
-
27
-
28
-
29
-
30
-
31
-
32
-
33
-
34
-
35
-
36
-
37
-
38
-
39
-
40
-
41
-
42
-
43
-
44
-
45
-
46
-
47
-
48
-
49
-
50
-
51
-
52
-
53
-
54
-
55
-
56
-
57
-
58
-
59
-
60
-
 61
61 -
 62
62 -
 63
63 -
 64
64 -
 65
65 -
 66
66 -
 67
67 -
 68
68 -
 69
69 -
 70
70 -
 71
71 -
 72
72 -
 73
73 -
 74
74 -
 75
75 -
 76
76 -
 77
77 -
 78
78 -
 79
79 -
 80
80 -
 81
81 -
82
-
83
-
84
-
85
-
86
-
87
-
88
-
89
-
90
-
91
-
92
-
93
-
94
 |
 |

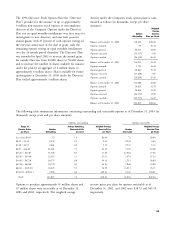
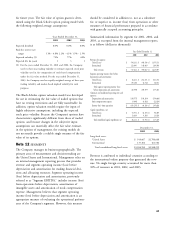
The 1996 Directors’ Stock Option Plan (the ‘‘Directors’ Activity under the Company’s stock option plans is sum-
Plan’’) provides for the issuance of up to approximately marized as follows (in thousands, except per share
4 million non-statutory stock options to non-employee amounts): Weighted
directors of the Company. Options under the Directors’ Average
Plan vest in equal monthly installments over four years for Options Exercise
Outstanding Price per Share
initial grants to new directors, and over four years for
annual grants, with 25 percent of such options vesting on Balance at December 31, 2000 118,325 $49.83
the one-year anniversary of the date of grant, with the Options assumed 50 26.12
remaining options vesting in equal monthly installments Options granted 60,211 18.60
over the 36-month period thereafter. The Directors’ Plan Options exercised (15,317) 3.82
was amended in April 2002 to increase the annual grant Options canceled (26,312) 60.45
for outside Directors from 20,000 shares to 50,000 shares Balance at December 31, 2001 136,957 39.22
and to increase the number of shares available for issuance Options assumed 3,725 16.82
under the plan by an aggregate of 2 million shares to Options granted 28,841 15.29
approximately 4 million shares. Shares available for future Options exercised (17,409) 3.87
option grants at December 31, 2003 under the Directors’ Options canceled (19,630) 47.36
Plan totaled approximately 3 million shares.
Balance at December 31, 2002 132,484 36.82
Options assumed 10,815 34.78
Options granted 20,606 35.20
Options exercised (24,353) 13.87
Options canceled (15,737) 54.27
Balance at December 31, 2003 123,815 $38.63
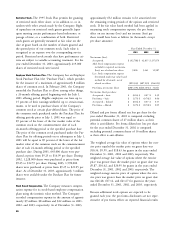
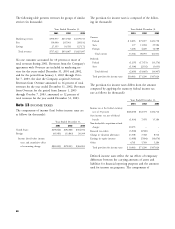
The following table summarizes information concerning outstanding and exercisable options as of December 31, 2003 (in
thousands, except years and per share amounts):
Options outstanding Options exercisable
Range of Average Remaining Weighted Average Weighted Average
Exercise Prices Number Contractual Life Exercise Price Number Exercise Price
per Share Outstanding (in years) per Share Exercisable per Share
Less than $0.01 72 1.6 $0.00 72 $0.00
$0.02 - $1.42 2,930 2.5 0.63 2,930 0.63
$1.48 - $6.73 2,661 4.0 5.15 2,533 5.13
$6.97 - $14.42 21,061 7.7 10.25 7,770 10.28
$14.44 - $22.87 31,704 8.1 17.46 12,062 17.46
$22.95 - $30.00 12,314 7.1 27.21 7,674 27.13
$30.05 - $47.18 20,175 8.8 39.16 2,715 38.89
$47.28 - $60.00 10,770 6.3 56.83 7,840 55.88
$60.31 - $105.50 14,225 5.7 76.19 13,013 76.15
$106.28 - $584.13 7,903 6.2 149.23 7,347 150.01
Total 123,815 7.3 $38.63 63,956 $49.26
Options to purchase approximately 63 million shares and exercise prices per share for options exercisable as of
67 million shares were exercisable as of December 31, December 31, 2001, and 2002 were $38.73 and $45.59,
2001 and 2002, respectively. The weighted average respectively.
65