Yahoo 2003 Annual Report Download - page 80
Download and view the complete annual report
Please find page 80 of the 2003 Yahoo annual report below. You can navigate through the pages in the report by either clicking on the pages listed below, or by using the keyword search tool below to find specific information within the annual report.-
 1
1 -
2
-
3
-
4
-
5
-
6
-
7
-
8
-
9
-
10
-
11
-
12
-
13
-
14
-
15
-
16
-
17
-
18
-
19
-
20
-
21
-
22
-
23
-
24
-
25
-
26
-
27
-
28
-
29
-
30
-
31
-
32
-
33
-
34
-
35
-
36
-
37
-
38
-
39
-
40
-
41
-
42
-
43
-
44
-
45
-
46
-
47
-
48
-
49
-
50
-
51
-
52
-
53
-
54
-
55
-
56
-
57
-
58
-
59
-
60
-
61
-
62
-
63
-
64
-
65
-
66
-
67
-
68
-
69
-
 70
70 -
 71
71 -
 72
72 -
 73
73 -
 74
74 -
 75
75 -
 76
76 -
 77
77 -
 78
78 -
 79
79 -
 80
80 -
 81
81 -
 82
82 -
 83
83 -
 84
84 -
 85
85 -
 86
86 -
 87
87 -
 88
88 -
 89
89 -
 90
90 -
91
-
92
-
93
-
94
 |
 |

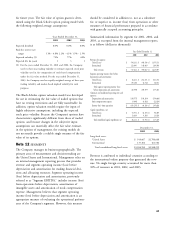
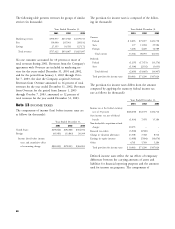
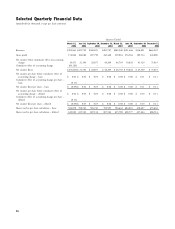
Selected Quarterly Financial Data
(unaudited) (in thousands, except per share amounts)
Quarters Ended
March 31, June 30, September 30, December 31, March 31, June 30, September 30, December 31,
2002 2002 2002 2002 2003 2003 2003 2003
Revenues $192,665 $225,792 $248,823 $285,787 $282,948 $321,406 $356,821 $663,922
Gross profit 154,844 184,084 207,790 243,468 239,816 274,564 309,534 443,080
Net income before cumulative effect of accounting
change 10,475 21,394 28,857 46,209 46,703 50,828 65,329 75,019
Cumulative effect of accounting change (64,120) –– –––– –
Net income (loss) $ (53,645) $ 21,394 $ 28,857 $ 46,209 $ 46,703 $ 50,828 $ 65,329 $ 75,019
Net income per share before cumulative effect of
accounting change – basic $ 0.02 $ 0.04 $ 0.05 $ 0.08 $ 0.08 $ 0.08 $ 0.11 $ 0.11
Cumulative effect of accounting change per share –
basic (0.11) –– –––– –
Net income (loss) per share – basic $ (0.09) $ 0.04 $ 0.05 $ 0.08 $ 0.08 $ 0.08 $ 0.11 $ 0.11
Net income per share before cumulative effect of
accounting change – diluted $ 0.02 $ 0.03 $ 0.05 $ 0.08 $ 0.08 $ 0.08 $ 0.10 $ 0.11
Cumulative effect of accounting change per share –
diluted (0.11) –– –––– –
Net income (loss) per share – diluted $ (0.09) $ 0.03 $ 0.05 $ 0.08 $ 0.08 $ 0.08 $ 0.10 $ 0.11
Shares used in per share calculation – basic 586,878 598,740 596,743 592,992 596,642 604,018 610,697 655,602
Shares used in per share calculation – diluted 610,020 615,542 607,134 607,544 615,788 628,577 637,444 686,514
74