Yahoo 2003 Annual Report Download - page 54
Download and view the complete annual report
Please find page 54 of the 2003 Yahoo annual report below. You can navigate through the pages in the report by either clicking on the pages listed below, or by using the keyword search tool below to find specific information within the annual report.-
 1
1 -
2
-
3
-
4
-
5
-
6
-
7
-
8
-
9
-
10
-
11
-
12
-
13
-
14
-
15
-
16
-
17
-
18
-
19
-
20
-
21
-
22
-
23
-
24
-
25
-
26
-
27
-
28
-
29
-
30
-
31
-
32
-
33
-
34
-
35
-
36
-
37
-
38
-
39
-
40
-
41
-
42
-
43
-
 44
44 -
 45
45 -
 46
46 -
 47
47 -
 48
48 -
 49
49 -
 50
50 -
 51
51 -
 52
52 -
 53
53 -
 54
54 -
 55
55 -
 56
56 -
 57
57 -
 58
58 -
 59
59 -
 60
60 -
 61
61 -
 62
62 -
 63
63 -
 64
64 -
65
-
66
-
67
-
68
-
69
-
70
-
71
-
72
-
73
-
74
-
75
-
76
-
77
-
78
-
79
-
80
-
81
-
82
-
83
-
84
-
85
-
86
-
87
-
88
-
89
-
90
-
91
-
92
-
93
-
94
 |
 |

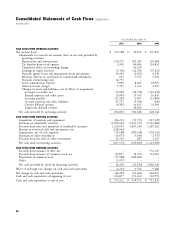
Consolidated Statements of Cash Flows YAHOO! INC.
(in thousands)
Years Ended December 31,
2001 2002 2003
CASH FLOWS FROM OPERATING ACTIVITIES:
Net income (loss) $ (92,788) $ 42,815 $ 237,879
Adjustments to reconcile net income (loss) to net cash provided by
operating activities:
Depreciation and amortization 130,575 109,389 159,688
Tax benefits from stock options 2,003 60,406 124,852
Cumulative effect of accounting change – 64,120 –
Earnings in equity interests (4,356) (22,301) (47,652)
Noncash (gains) losses and impairments from investments 30,430 (2,422) 6,140
Minority interests in operations of consolidated subsidiaries 693 1,551 5,921
Noncash restructuring costs 14,791 ––
Stock compensation expense 9,096 8,402 22,029
Other non-cash charges 1,993 2,313 4,907
Changes in assets and liabilities, net of effects of acquisitions:
Accounts receivable, net 27,628 (30,798) (122,220)
Prepaid expenses and other assets (9,003) 29,555 16,835
Accounts payable (27,202) 4,507 (12,889)
Accrued expenses and other liabilities 31,571 (9,904) (640)
Current deferred revenue (8,581) 14,815 33,294
Long-term deferred revenue – 30,000 –
Net cash provided by operating activities 106,850 302,448 428,144
CASH FLOWS FROM INVESTING ACTIVITIES:
Acquisition of property and equipment (86,211) (51,553) (117,329)
Purchases of marketable securities (1,200,623) (1,165,711) (1,916,800)
Proceeds from sales and maturities of marketable securities 1,329,076 1,067,540 1,289,202
Increase in restricted cash and investments, net (228,662) ––
Acquisitions, net of cash acquired (19,188) (189,168) (376,236)
Purchases of other investments (13,075) (7,649) (3,747)
Proceeds from the sales of other investments 11,510 687 3,321
Net cash used in investing activities (207,173) (345,854) (1,121,589)
CASH FLOWS FROM FINANCING ACTIVITIES:
Proceeds from issuance of debt, net ––733,125
Proceeds from issuance of common stock, net 83,875 78,190 353,201
Repurchase of common stock (59,988) (100,000) –
Other (5,597) ––
Net cash provided by (used in) financing activities 18,290 (21,810) 1,086,326
Effect of exchange rate changes on cash and cash equivalents (2,212) 3,556 9,686
Net change in cash and cash equivalents (84,245) (61,660) 402,567
Cash and cash equivalents at beginning of year 456,877 372,632 310,972
Cash and cash equivalents at end of year $ 372,632 $ 310,972 $ 713,539
48