Yahoo 2003 Annual Report Download - page 33
Download and view the complete annual report
Please find page 33 of the 2003 Yahoo annual report below. You can navigate through the pages in the report by either clicking on the pages listed below, or by using the keyword search tool below to find specific information within the annual report.-
 1
1 -
2
-
3
-
4
-
5
-
6
-
7
-
8
-
9
-
10
-
11
-
12
-
13
-
14
-
15
-
16
-
17
-
18
-
19
-
20
-
21
-
22
-
 23
23 -
 24
24 -
 25
25 -
 26
26 -
 27
27 -
 28
28 -
 29
29 -
 30
30 -
 31
31 -
 32
32 -
 33
33 -
 34
34 -
 35
35 -
 36
36 -
 37
37 -
 38
38 -
 39
39 -
 40
40 -
 41
41 -
 42
42 -
 43
43 -
44
-
45
-
46
-
47
-
48
-
49
-
50
-
51
-
52
-
53
-
54
-
55
-
56
-
57
-
58
-
59
-
60
-
61
-
62
-
63
-
64
-
65
-
66
-
67
-
68
-
69
-
70
-
71
-
72
-
73
-
74
-
75
-
76
-
77
-
78
-
79
-
80
-
81
-
82
-
83
-
84
-
85
-
86
-
87
-
88
-
89
-
90
-
91
-
92
-
93
-
94
 |
 |

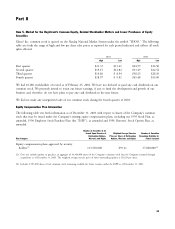
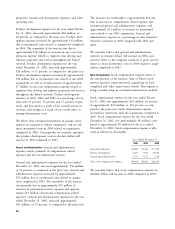
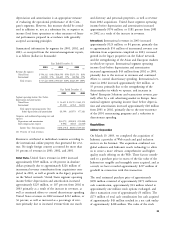
Item 7. Management’s Discussion and Analysis of December 31, 2002 and 2003 were as follows (dollars in
Financial Condition and Results of Operations thousands):
This Report contains forward-looking statements within the Year-over-Year Year-over-Year
Revenues 2002 2003 Growth ($) Growth (%)
meaning of Section 27A of the Securities Act of 1933, as
amended, and Section 21E of the Securities Exchange Act of Marketing
1934, as amended, including, without limitation, statements services $651,568 $1,199,733 $548,165 84%
regarding the Company’s expectations, beliefs, intentions or Fees 207,941 298,192 90,251 43%
future strategies that are signified by the words ‘‘expects,’’ Listings 93,558 127,172 33,614 36%
‘‘anticipates,’’ ‘‘intends,’’ ‘‘believes,’’ or similar language. These Total revenues $953,067 $1,625,097 $672,030 71%
forward-looking statements, including those with respect to
our operating results for 2004, are based upon current expec- Marketing services revenue is primarily generated from the
tations and beliefs of the Company’s management and are sale of rich media advertisements, sponsorship and
subject to risks and uncertainties that could cause results to text-link advertisements, (including pay-for-performance
differ materially from those indicated in the forward-looking search advertisements), paid inclusion, algorithmic searches
statements. Some, but not all, of the factors, which could and transactions revenue. The increase in marketing ser-
cause actual results to differ materially include those set forth vices in 2003 compared to 2002 was due to incremental
in the section in this Annual Report on Form 10-K entitled revenue contribution from our 2003 acquisitions and
‘‘Risk Factors’’ and elsewhere in this report. The Company strong growth in the balance of Yahoo!’s global legacy
undertakes no obligation to revise or publicly release the (non-acquisition related) marketing services revenue. For
results of any revision to these forward-looking statements, or the year ended December 31, 2003, approximately
to explain why actual results differ. Readers should carefully 74 percent of our total revenues came from marketing
review the risk factors described in this document and in any services. Fees revenue is generated from a variety of con-
reports subsequently filed with the Securities and Exchange sumer and business fee-based services. Fees revenue
Commission (‘‘SEC’’). increased in 2003 when compared to 2002 due to an
increase in the number of paying users for our fee-based
Overview
services, from approximately 2.2 million paying users at
Yahoo! Inc., including its consolidated subsidiaries, December 31, 2002 to approximately 4.9 million paying
(‘‘Yahoo!’’) is a global Internet company that offers a com- users at December 31, 2003. Average revenue per paying
prehensive branded network of properties and services to user per month declined from approximately $7 per user
consumers and businesses worldwide. As the first online per month in 2002 to approximately $5 per user per
navigational guide to the Web, www.yahoo.com, is a lead- month in 2003 as a result of faster subscriber growth in
ing guide in terms of traffic, advertising, household and some of the lower priced offerings, and the introduction
business user reach. Yahoo!’s global brand reaches the larg- of lower priced fee-based products offered in 2003. List-
est audience worldwide. Headquartered in Sunnyvale, Cal- ings revenue consists of revenues generated from a variety
ifornia, we have offices in the United States, Europe, Asia, of consumer and business listings-based services. Listings
Latin America, Australia and Canada. revenue increased as compared to the prior year, primarily
from our Search & Marketplace listings.
We manage our business geographically. We rely on an
internal management reporting process that provides reve-
nue and certain operating cost information for making
financial decisions and allocating resources. Our principal
areas of measurement and decision-making are the United
States and International.
We generate service revenues from our marketing services,
fees and listings offerings. Revenues for the years ended
27