Yahoo 2003 Annual Report Download - page 40
Download and view the complete annual report
Please find page 40 of the 2003 Yahoo annual report below. You can navigate through the pages in the report by either clicking on the pages listed below, or by using the keyword search tool below to find specific information within the annual report.-
 1
1 -
2
-
3
-
4
-
5
-
6
-
7
-
8
-
9
-
10
-
11
-
12
-
13
-
14
-
15
-
16
-
17
-
18
-
19
-
20
-
21
-
22
-
23
-
24
-
25
-
26
-
27
-
28
-
29
-
 30
30 -
 31
31 -
 32
32 -
 33
33 -
 34
34 -
 35
35 -
 36
36 -
 37
37 -
 38
38 -
 39
39 -
 40
40 -
 41
41 -
 42
42 -
 43
43 -
 44
44 -
 45
45 -
 46
46 -
 47
47 -
 48
48 -
 49
49 -
 50
50 -
51
-
52
-
53
-
54
-
55
-
56
-
57
-
58
-
59
-
60
-
61
-
62
-
63
-
64
-
65
-
66
-
67
-
68
-
69
-
70
-
71
-
72
-
73
-
74
-
75
-
76
-
77
-
78
-
79
-
80
-
81
-
82
-
83
-
84
-
85
-
86
-
87
-
88
-
89
-
90
-
91
-
92
-
93
-
94
 |
 |
an average of approximately 3.9 percent in 2002 to Income Taxes. The provision for income taxes for 2003,
2.3 percent in 2003. Other income, net decreased approx- 2002 and 2001 differs from the amount computed by
imately $3 million in 2002, as compared to 2001. Interest applying the statutory federal rate principally due to for-
and investment income decreased as a result of lower aver- eign losses for which no tax benefit was provided, nonde-
age investment balances and declining interest rates in ductible stock-based compensation charges, tax credits,
2002 as compared to 2001. Interest rates decreased from increased valuation allowance related to impairment write-
an average of approximately 5.6 percent in 2001 to downs of equity investments, and nondeductible costs
3.9 percent in 2002. In addition, the Company recorded related to acquisitions.
$9 million of income in 2001 related to early termination
The increase in the provision for income taxes in 2003
of a long-term advertising contract, whereby the customer
from 2002 of approximately $76 million was primarily a
terminated the remaining portion of its original agreement
result of increases in Federal and State income taxes,
and agreed to pay the Company a negotiated termination
driven by higher pretax income in 2003 compared to
fee to settle the commitment. The Company did not pro-
2002. This increase included approximately $9 million of
vide the advertising related to the cancelled commitment,
valuation allowance for 2003 compared to approximately
and therefore recorded the termination fee as other
$7 million for 2002. The change in valuation allowance
income. These decreases were partially offset by gains of
from 2002 to 2003 was driven by an increase of foreign
approximately $2 million on investments in 2002, com-
losses for which no tax benefit was provided for 2003 as
pared to losses of approximately $27 million on invest-
compared to 2002. The effective tax rate for 2003 was
ments in 2001.
38 percent compared to 40 percent in 2002. The increase
Other income, net in future periods may fluctuate as a in the provision for income taxes in 2002 from 2001 of
result of changes in our average investment balances held, approximately $60 million was primarily a result of
changes in market rates or the sale of investments, and increases in Federal and State income taxes, driven by
investment impairments. pretax income for 2002 compared to pretax loss in 2001.
This increase was partially offset by non-deductible acqui-
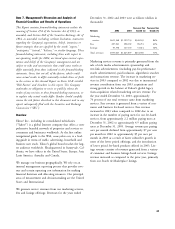
Earnings in Equity Interests. Earnings in equity interests was sition related charges in 2001 that did not occur in 2002,
approximately $48 million for the year ended Decem- which had a tax effect of approximately $20 million, as
ber 31, 2003 compared to approximately $22 million in well as approximately $7 million of increase in the valua-
2002 and approximately $4 million in 2001, as a result of tion allowance for 2002 compared to approximately
our investment in Yahoo! Japan. See Note 8 – ‘‘Joint Ven- $24 million of increases for 2001. The change in valua-
tures’’ in the Financial Statements for Yahoo! Japan’s con- tion allowance from 2001 to 2002 was driven by a signifi-
densed financial information. cant reduction in impairment write-downs and foreign
losses not benefited for 2002 as compared to 2001. The
Minority Interests in Operations of Consolidated Subsidiaries. Minor- effective tax rate for 2002 was 40 percent compared to a
ity interests in operations of consolidated subsidiaries rep- benefit of 13 percent in 2001.
resents the minority partners’ percentage share of income
or losses from such subsidiaries in which we hold a major- Business Segment Results
ity ownership interest, but less than 100 percent, and con- We manage our business geographically. Our primary
solidate the subsidiaries’ results in our financial statements. areas of measurement and decision-making are the United
States and International. Management relies on an internal
Minority interests in income from operations of management reporting process that provides revenue and
consolidated subsidiaries was approximately $6 million, segment operating income (loss) before depreciation and
$2 million, and $1 million for 2003, 2002, and 2001, amortization for making financial decisions and allocating
respectively. The change from 2002 to 2003 was due to resources. Segment operating income (loss) before depreci-
income in Europe in 2003, compared to losses in 2002, ation and amortization, previously referred to as ‘‘Segment
and increased income in Korea. The change from 2001 to EBITDA,’’ includes income (loss) from operations before
2002 was due to increased income in Korea and reduced depreciation, amortization of intangible assets and amorti-
losses in Europe. See Note 8 – ‘‘Joint Ventures.’’ zation of stock compensation expense. Management
believes that segment operating income (loss) before
34