Yahoo 2003 Annual Report Download - page 41
Download and view the complete annual report
Please find page 41 of the 2003 Yahoo annual report below. You can navigate through the pages in the report by either clicking on the pages listed below, or by using the keyword search tool below to find specific information within the annual report.-
 1
1 -
2
-
3
-
4
-
5
-
6
-
7
-
8
-
9
-
10
-
11
-
12
-
13
-
14
-
15
-
16
-
17
-
18
-
19
-
20
-
21
-
22
-
23
-
24
-
25
-
26
-
27
-
28
-
29
-
30
-
 31
31 -
 32
32 -
 33
33 -
 34
34 -
 35
35 -
 36
36 -
 37
37 -
 38
38 -
 39
39 -
 40
40 -
 41
41 -
 42
42 -
 43
43 -
 44
44 -
 45
45 -
 46
46 -
 47
47 -
 48
48 -
 49
49 -
 50
50 -
 51
51 -
52
-
53
-
54
-
55
-
56
-
57
-
58
-
59
-
60
-
61
-
62
-
63
-
64
-
65
-
66
-
67
-
68
-
69
-
70
-
71
-
72
-
73
-
74
-
75
-
76
-
77
-
78
-
79
-
80
-
81
-
82
-
83
-
84
-
85
-
86
-
87
-
88
-
89
-
90
-
91
-
92
-
93
-
94
 |
 |

depreciation and amortization is an appropriate measure and directory and personals properties, as well as revenue
of evaluating the operational performance of the Com- from 2002 acquisitions. United States segment operating
pany’s segments. However, this measure should be consid- income before depreciation and amortization increased
ered in addition to, not as a substitute for, or superior to, approximately $196 million, or 1181 percent from 2001
income (loss) from operations or other measures of finan- to 2002 as a result of the increase in revenues.
cial performance prepared in accordance with generally
International. International revenues in 2003 increased
accepted accounting principles.
approximately $123 million, or 84 percent, primarily due
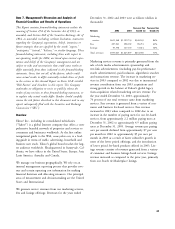
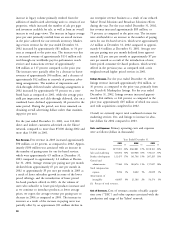
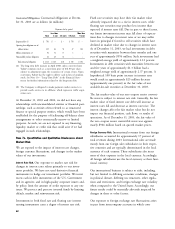
Summarized information by segment for 2001, 2002, and to approximately $53 million of incremental revenue con-
2003, as excerpted from the internal management reports, tribution from acquisitions completed in 2003, increased
is as follows (dollars in thousands): growth in the legacy properties on the Yahoo! network,
and the strengthening of the Asian and European markets
Years Ended December 31,
in which we operate. International segment operating
2001 2002 2003 income (loss) before depreciation and amortization
(1) (1) (1) increased approximately $43 million from 2002 to 2003,
Revenues by segment:
United States $ 594,332 83% $ 806,598 85% $1,355,153 83%
primarily due to the increase in revenues and continued
International 123,090 17% 146,469 15% 269,944 17%
efforts to control discretionary spending. International rev-
Total revenues $ 717,422 100% $ 953,067 100% $1,625,097 100%
enues in 2002 increased approximately $23 million, or
19 percent, primarily due to the strengthening of the
Years Ended December 31,
Asian markets in which we operate, and increases in
2001 2002 2003 Yahoo! Enterprise Solutions and transactions revenue, par-
Segment operating income (loss) before
tially offset by a soft advertising market in Europe. Inter-
depreciation and amortization:
national segment operating income (loss) before deprecia-
United States $ 16,611 $ 212,721 $ 441,372
International (35,210) (6,742) 36,011
tion and amortization increased approximately $28 million
Total segment operating income (loss)
from 2001 to 2002, primarily due to the non-recurrence
before depreciation and amortization (18,599) 205,979 477,383
of the 2001 restructuring programs and a reduction in
Corporate and unallocated operating costs and
discretionary spending.
expenses:
Depreciation and amortization (130,575) (109,389) (159,688)
Stock compensation expense (9,096) (8,402) (22,029)
Acquisitions
Income (loss) from operations $(158,270) $ 88,188 $ 295,666
Inktomi Corporation
(1) Percent of total revenues.
On March 19, 2003, we completed the acquisition of
Revenue is attributed to individual countries according to Inktomi, a provider of Web search and paid inclusion
the international online property that generated the reve- services on the Internet. The acquisition combined our
nue. No single foreign country accounted for more than global audience and Inktomi’s search technology to allow
10 percent of revenues in 2003, 2002, and 2001. us to create a more relevant, comprehensive and higher
quality search offering on the Web. These factors contrib-
United States. United States revenues in 2003 increased uted to a purchase price in excess of the fair value of the
approximately $549 million, or 68 percent in absolute Inktomi net tangible and intangible assets acquired, and as
dollars primarily due to approximately $226 million of a result, we have recorded approximately $217 million of
incremental revenue contribution from acquisitions com- goodwill in connection with this transaction.
pleted in 2003, as well as growth in the legacy properties
on the Yahoo! network. United States segment operating The total estimated purchase price of approximately
income before depreciation and amortization increased $290 million consisted of approximately $273 million in
approximately $229 million, or 107 percent from 2002 to cash consideration, approximately $14 million related to
2003 primarily as a result of the increase in revenues, as approximately one million stock options exchanged, and
well as continued efforts to control discretionary spending. direct transaction costs of approximately $3 million. The
United States revenues in 2002 increased $212 million, or $273 million of total cash consideration less cash acquired
36 percent, as well as increased as a percentage of reve- of approximately $45 million resulted in a net cash outlay
nues primarily due to increased revenue from our search of approximately $228 million. The value of the stock
35