Yahoo 2003 Annual Report Download - page 63
Download and view the complete annual report
Please find page 63 of the 2003 Yahoo annual report below. You can navigate through the pages in the report by either clicking on the pages listed below, or by using the keyword search tool below to find specific information within the annual report.-
 1
1 -
2
-
3
-
4
-
5
-
6
-
7
-
8
-
9
-
10
-
11
-
12
-
13
-
14
-
15
-
16
-
17
-
18
-
19
-
20
-
21
-
22
-
23
-
24
-
25
-
26
-
27
-
28
-
29
-
30
-
31
-
32
-
33
-
34
-
35
-
36
-
37
-
38
-
39
-
40
-
41
-
42
-
43
-
44
-
45
-
46
-
47
-
48
-
49
-
50
-
51
-
52
-
 53
53 -
 54
54 -
 55
55 -
 56
56 -
 57
57 -
 58
58 -
 59
59 -
 60
60 -
 61
61 -
 62
62 -
 63
63 -
 64
64 -
 65
65 -
 66
66 -
 67
67 -
 68
68 -
 69
69 -
 70
70 -
 71
71 -
 72
72 -
 73
73 -
74
-
75
-
76
-
77
-
78
-
79
-
80
-
81
-
82
-
83
-
84
-
85
-
86
-
87
-
88
-
89
-
90
-
91
-
92
-
93
-
94
 |
 |

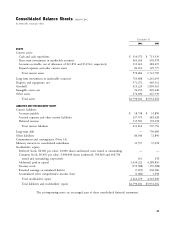
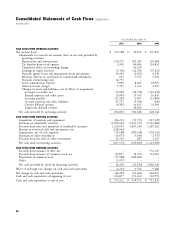
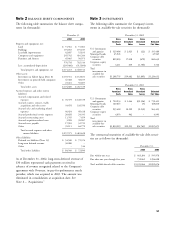
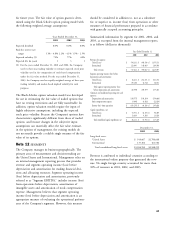
Note 2 BALANCE SHEET COMPONENTS Note 3 INVESTMENTS
The following table summarizes the balance sheet compo- The following tables summarize the Company’s invest-
nents (in thousands): ments in available-for-sale securities (in thousands):
December 31, December 31, 2002
2002 2003 Gross Gross Gross
Amortized Unrealized Unrealized Estimated
Property and equipment, net: Costs Gains Losses Fair Value
Land $ 51,561 $ 51,061 U.S. Government
Buildings 191,183 191,183 and agencies $ 329,486 $ 2,025 $ (22) $ 331,489
Leasehold improvements 42,607 52,833 Municipal bonds 45,945 ––45,945
Computers and equipment 245,742 416,266 Corporate debt
Furniture and fixtures 45,645 50,973 securities 829,093 17,018 (479) 845,632
Corporate equity
576,738 762,316 securities 4,211 639 (1,304) 3,546
Less: accumulated depreciation (205,466) (312,804)
Total
Total property and equipment, net $ 371,272 $ 449,512 investments in
Other assets: available-for-
sale securities $1,208,735 $19,682 $(1,805) $1,226,612
Investment in Yahoo! Japan (Note 8) $ 103,331 $ 152,831
Investments in privately-held companies 47,468 38,105
Other 23,221 56,603 December 31, 2003
Total other assets $ 174,020 $ 247,539 Gross Gross Gross
Accrued expenses and other current Amortized Unrealized Unrealized Estimated
liabilities: Costs Gains Losses Fair Value
Accrued compensation and related U.S. Government
expenses $ 76,379 $ 128,339 and agencies $ 720,933 $ 1,044 $(2,526) $ 719,451
Accrued content, connect, traffic Municipal bonds 169,815 – (5) 169,810
acquisition and other costs 39,478 138,550 Corporate debt
Accrued sales and marketing related securities 955,418 10,229 (2,232) 963,415
expenses 46,424 48,418 Corporate equity
Accrued professional service expenses 20,628 24,391 securities 4,053 942 – 4,995
Accrued restructuring costs 11,745 7,459 Total
Accrued acquisition-related costs 5,909 38,967 investments in
Accrued taxes payable 17,901 32,725 available-for-
Other 39,111 64,779 sale securities $1,850,219 $12,215 $(4,763) $1,857,671
Total accrued expenses and other
current liabilities $ 257,575 $ 483,628 The contractual maturities of available-for-sale debt securi-
Other liabilities: ties are as follows (in thousands):
Deferred tax liabilities (Note 13) $ 54,540 $ 72,374
Long-term deferred revenue 30,000 –
December 31,
Other – 516
2002 2003
Total other liabilities $ 84,540 $ 72,890
Due within one year $ 463,204 $ 595,978
As of December 31, 2002, long-term deferred revenue of Due after one year through five years 759,862 1,256,698
$30 million represented cash payments received in Total available-for-sale debt securities $1,223,066 $1,852,676
advance of revenue recognized related to the Company’s
agreement with Overture, its pay-for-performance search
provider, which was acquired in 2003. The amount was
eliminated in consolidation at acquisition date. See
Note 6 – ‘‘Acquisitions.’’
57