Yahoo 2003 Annual Report Download - page 37
Download and view the complete annual report
Please find page 37 of the 2003 Yahoo annual report below. You can navigate through the pages in the report by either clicking on the pages listed below, or by using the keyword search tool below to find specific information within the annual report.-
 1
1 -
2
-
3
-
4
-
5
-
6
-
7
-
8
-
9
-
10
-
11
-
12
-
13
-
14
-
15
-
16
-
17
-
18
-
19
-
20
-
21
-
22
-
23
-
24
-
25
-
26
-
 27
27 -
 28
28 -
 29
29 -
 30
30 -
 31
31 -
 32
32 -
 33
33 -
 34
34 -
 35
35 -
 36
36 -
 37
37 -
 38
38 -
 39
39 -
 40
40 -
 41
41 -
 42
42 -
 43
43 -
 44
44 -
 45
45 -
 46
46 -
 47
47 -
48
-
49
-
50
-
51
-
52
-
53
-
54
-
55
-
56
-
57
-
58
-
59
-
60
-
61
-
62
-
63
-
64
-
65
-
66
-
67
-
68
-
69
-
70
-
71
-
72
-
73
-
74
-
75
-
76
-
77
-
78
-
79
-
80
-
81
-
82
-
83
-
84
-
85
-
86
-
87
-
88
-
89
-
90
-
91
-
92
-
93
-
94
 |
 |
Traffic Acquisition Costs. Traffic acquisition costs consist of directly correlate to revenues as many of our service offer-
payments made to our affiliates that have integrated our ings are free.
pay-for-performance search service into their sites. We
We currently anticipate that cost of revenues will continue
enter into agreements of varying durations with affiliates
to increase in absolute dollars in 2004 compared to 2003,
that integrate our pay-for-performance search service into
as network usage is expected to increase and we expect to
their sites. There are generally three economic structures
incur costs relating to introduction of additional content
of the affiliate agreements: fixed payments based on a
for new and enhanced services. In addition, we believe we
guaranteed minimum amount of traffic delivered, which
will incur higher costs, including TAC, in 2004 as com-
often carry reciprocal performance guarantees from the
pared to 2003, due to acquisitions made in 2003.
affiliate, variable payments based on a percentage of our
revenue or based on a certain metric, such as number of
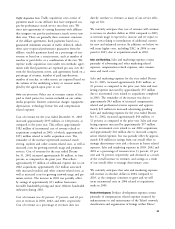
Sales and Marketing. Sales and marketing expenses consist
searches or paid clicks, or a combination of the two. We primarily of advertising and other marketing related
expense traffic acquisition costs under two methods; agree- expenses, compensation related expenses, sales commis-
ments with fixed payments are expensed pro-rata over the sions and travel costs.
term the fixed payment covers, and agreements based on a
percentage of revenue, number of paid introductions, Sales and marketing expenses for the year ended Decem-
number of searches, or other metric are expensed based on ber 31, 2003, increased approximately $101 million, or
the volume of the underlying activity or revenue multi- 23 percent, as compared to the prior year. Sales and mar-
plied by the agreed-upon price or rate. keting expenses increased by approximately $37 million
due to incremental costs related to acquisitions completed
Other cost of revenues. Other cost of revenues consist of fees in 2003. The remainder of the increase was due to
paid to third parties for content included on our online approximately $43 million of increased compensation
media properties, Internet connection charges, equipment related and professional services expenses and approxi-
depreciation, technology license fees and compensation mately $21 million in increased advertising spending.
related expenses. Sales and marketing expenses for the year ended Decem-
ber 31, 2002, increased approximately $46 million, or
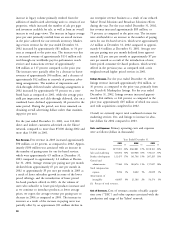
Cost of revenues for the year ended December 31, 2003
12 percent, as compared to the prior year. Sales and mar-
increased approximately $195 million, or 120 percent, as
keting expenses increased by approximately $57 million
compared to the prior year. This reflects approximately
due to incremental costs related to our 2002 acquisitions,
$182 million of incremental cost of revenue related to
and approximately $22 million due to increased compen-
acquisitions completed in 2003, of which, approximately
sation related expenses, but was partially offset by approxi-
$153 million related to traffic acquisition costs. The
mately $34 million in savings from our overall effort to
remainder of the increase represented increased search
manage discretionary costs and a decrease in barter related
serving, royalties and other content-related costs, as well as
expenses. Sales and marketing expenses in 2003, 2002 and
increased costs for growing network usage and premium
2001 as a percentage of revenues were 33 percent, 45 per-
services. Cost of revenues for the year ended Decem-
cent and 54 percent, respectively, and decreased as a result
ber 31, 2002 increased approximately $6 million, or four
of the overall increase in revenues, and savings as a result
percent, as compared to the prior year. This reflects
of our overall effort to manage discretionary costs.
approximately $7 million of additional expense due to our
2002 acquisitions, approximately $12 million associated We currently anticipate that sales and marketing expenses
with increased royalties and other content-related costs, as will increase in absolute dollars in 2004 compared to
well as increased costs for growing network usage and pre- 2003, as the company continues to grow and we will
mium services. The increase in 2002 was partially offset incur incremental costs in 2004 related to acquisitions
by savings of approximately $13 million from more made in 2003.
favorable bandwidth pricing and more efficient bandwidth
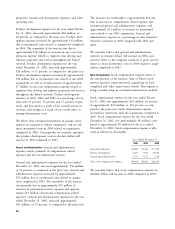
utilization during 2002. Product Development. Product development expenses consist
primarily of compensation related expenses incurred for
Cost of revenues was 22 percent, 17 percent, and 22 per- enhancements to and maintenance of the Yahoo! network,
cent of revenues in 2003, 2002, and 2001, respectively. classification and organization of listings within Yahoo!
Cost of revenues as a percentage of revenues does not
31