Yahoo 2003 Annual Report Download - page 52
Download and view the complete annual report
Please find page 52 of the 2003 Yahoo annual report below. You can navigate through the pages in the report by either clicking on the pages listed below, or by using the keyword search tool below to find specific information within the annual report.-
 1
1 -
2
-
3
-
4
-
5
-
6
-
7
-
8
-
9
-
10
-
11
-
12
-
13
-
14
-
15
-
16
-
17
-
18
-
19
-
20
-
21
-
22
-
23
-
24
-
25
-
26
-
27
-
28
-
29
-
30
-
31
-
32
-
33
-
34
-
35
-
36
-
37
-
38
-
39
-
40
-
41
-
 42
42 -
 43
43 -
 44
44 -
 45
45 -
 46
46 -
 47
47 -
 48
48 -
 49
49 -
 50
50 -
 51
51 -
 52
52 -
 53
53 -
 54
54 -
 55
55 -
 56
56 -
 57
57 -
 58
58 -
 59
59 -
 60
60 -
 61
61 -
 62
62 -
63
-
64
-
65
-
66
-
67
-
68
-
69
-
70
-
71
-
72
-
73
-
74
-
75
-
76
-
77
-
78
-
79
-
80
-
81
-
82
-
83
-
84
-
85
-
86
-
87
-
88
-
89
-
90
-
91
-
92
-
93
-
94
 |
 |

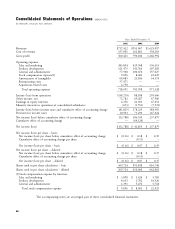
Consolidated Statements of Operations YAHOO! INC.
(in thousands, except per share amounts)
Years Ended December 31,
2001 2002 2003
Revenues $717,422 $953,067 $1,625,097
Cost of revenues 157,001 162,881 358,103
Gross profit 560,421 790,186 1,266,994
Operating expenses:
Sales and marketing 383,854 429,968 530,613
Product development 121,475 141,766 207,285
General and administrative 77,960 100,676 157,027
Stock compensation expense(1) 9,096 8,402 22,029
Amortization of intangibles 64,085 21,186 54,374
Restructuring costs 57,471 ——
Acquisition-related costs 4,750 ——
Total operating expenses 718,691 701,998 971,328
Income (loss) from operations (158,270) 88,188 295,666
Other income, net 72,782 69,287 47,506
Earnings in equity interests 4,356 22,301 47,652
Minority interests in operations of consolidated subsidiaries (693) (1,551) (5,921)
Income (loss) before income taxes and cumulative effect of accounting change (81,825) 178,225 384,903
Provision for income taxes 10,963 71,290 147,024
Net income (loss) before cumulative effect of accounting change (92,788) 106,935 237,879
Cumulative effect of accounting change — (64,120) —
Net income (loss) $ (92,788) $ 42,815 $ 237,879
Net income (loss) per share – basic:
Net income (loss) per share before cumulative effect of accounting change $ (0.16) $ 0.18 $ 0.39
Cumulative effect of accounting change per share – (0.11) –
Net income (loss) per share – basic $ (0.16) $ 0.07 $ 0.39
Net income (loss) per share – diluted:
Net income (loss) per share before cumulative effect of accounting change $ (0.16) $ 0.18 $ 0.37
Cumulative effect of accounting change per share – (0.11) –
Net income (loss) per share – diluted $ (0.16) $ 0.07 $ 0.37
Shares used in per share calculation – basic 569,724 593,838 616,740
Shares used in per share calculation – diluted 569,724 610,060 642,081
(1)Stock compensation expense by function:
Sales and marketing $ 3,090 $ 1,424 $ 5,785
Product development 4,615 1,702 10,526
General and administrative 1,391 5,276 5,718
Total stock compensation expense $ 9,096 $ 8,402 $ 22,029
The accompanying notes are an integral part of these consolidated financial statements.
46