Yahoo 2003 Annual Report Download - page 73
Download and view the complete annual report
Please find page 73 of the 2003 Yahoo annual report below. You can navigate through the pages in the report by either clicking on the pages listed below, or by using the keyword search tool below to find specific information within the annual report.-
 1
1 -
2
-
3
-
4
-
5
-
6
-
7
-
8
-
9
-
10
-
11
-
12
-
13
-
14
-
15
-
16
-
17
-
18
-
19
-
20
-
21
-
22
-
23
-
24
-
25
-
26
-
27
-
28
-
29
-
30
-
31
-
32
-
33
-
34
-
35
-
36
-
37
-
38
-
39
-
40
-
41
-
42
-
43
-
44
-
45
-
46
-
47
-
48
-
49
-
50
-
51
-
52
-
53
-
54
-
55
-
56
-
57
-
58
-
59
-
60
-
61
-
62
-
 63
63 -
 64
64 -
 65
65 -
 66
66 -
 67
67 -
 68
68 -
 69
69 -
 70
70 -
 71
71 -
 72
72 -
 73
73 -
 74
74 -
 75
75 -
 76
76 -
 77
77 -
 78
78 -
 79
79 -
 80
80 -
 81
81 -
 82
82 -
 83
83 -
84
-
85
-
86
-
87
-
88
-
89
-
90
-
91
-
92
-
93
-
94
 |
 |

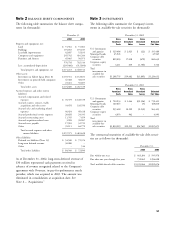
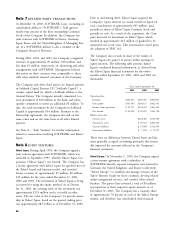
for future years. The fair value of option grants is deter- should be considered in addition to, not as a substitute
mined using the Black-Scholes option pricing model with for, or superior to, income (loss) from operations or other
the following weighted average assumptions: measures of financial performance prepared in accordance
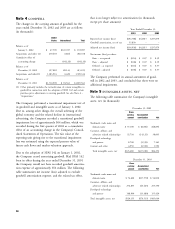
with generally accepted accounting principles.
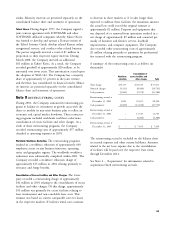
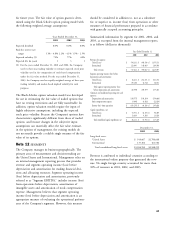
Years Ended December 31, Summarized information by segment for 2001, 2002, and
2001 2002 2003 2003, as excerpted from the internal management reports,
is as follows (dollars in thousands):
Expected dividend 0.0% 0.0% 0.0%
Risk-free interest rate
Years Ended December 31,
ranges 3.1% - 4.8% 2.2% - 4.1% 1.5% - 2.5%
2001 2002 2003
Expected volatility (1) 79% 77% 62%
Revenues by segment:
Expected life (in years) 3 3 3
United States $ 594,332 $ 806,598 $ 1,355,153
(1) For the years ended December 31, 2001 and 2002, the Company
International 123,090 146,469 269,944
used its three-year trailing volatility to estimate expected stock price
Total revenues $ 717,422 $ 953,067 $ 1,625,097
volatility used in the computation of stock-based compensation
Segment operating income (loss) before
under the fair value method. For the year ended December 31,
depreciation and amortization:
United States $ 16,611 $ 212,721 $ 441,372
2003, the Company used an equally weighted average of three-year
International (35,210) (6,742) 36,011
trailing volatility and market-based implied volatility for such
Total segment operating income (loss)
purposes.
before depreciation and amortization (18,599) 205,979 477,383
Corporate and unallocated operating costs and
The Black-Scholes option valuation model was developed
expenses:
Depreciation and amortization (130,575) (109,389) (159,688)
for use in estimating the fair value of traded options that
Stock compensation expense (9,096) (8,402) (22,029)
have no vesting restrictions and are fully transferable. In
Income (loss) from operations $ (158,270) $ 88,188 $ 295,666
addition, option valuation models require the input of
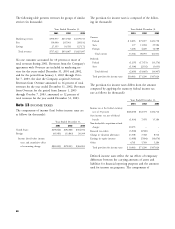
Capital expenditures, net:
highly subjective assumptions, including the expected
United States $ 72,572 $ 42,193 $ 94,305
stock price volatility. Because the Company’s options have
International 13,639 9,360 23,024
characteristics significantly different from those of traded
Total consolidated capital expenditures, net $ 86,211 $ 51,553 $ 117,329
options, and because changes in the subjective input
assumptions can materially affect the fair value estimate, December 31,
in the opinion of management, the existing models do 2002 2003
not necessarily provide a reliable single measure of the fair Long-lived assets:
value of its options. United States $ 919,667 $2,786,668
International 137,102 161,584
Note 12 SEGMENTS Total consolidated long-lived assets $1,056,769 $2,948,252
The Company manages its business geographically. The
primary areas of measurement and decision-making are Revenue is attributed to individual countries according to
the United States and International. Management relies on the international online property that generated the reve-
an internal management reporting process that provides nue. No single foreign country accounted for more than
revenue and segment operating income (loss) before 10% of revenues in 2001, 2002, and 2003.
depreciation and amortization for making financial deci-
sions and allocating resources. Segment operating income
(loss) before depreciation and amortization, previously
referred to as ‘‘Segment EBITDA,’’ includes income (loss)
from operations before depreciation, amortization of
intangible assets and amortization of stock compensation
expense. Management believes that segment operating
income (loss) before depreciation and amortization is an
appropriate measure of evaluating the operational perform-
ance of the Company’s segments. However, this measure
67