Yahoo 2003 Annual Report Download - page 46
Download and view the complete annual report
Please find page 46 of the 2003 Yahoo annual report below. You can navigate through the pages in the report by either clicking on the pages listed below, or by using the keyword search tool below to find specific information within the annual report.-
 1
1 -
2
-
3
-
4
-
5
-
6
-
7
-
8
-
9
-
10
-
11
-
12
-
13
-
14
-
15
-
16
-
17
-
18
-
19
-
20
-
21
-
22
-
23
-
24
-
25
-
26
-
27
-
28
-
29
-
30
-
31
-
32
-
33
-
34
-
35
-
 36
36 -
 37
37 -
 38
38 -
 39
39 -
 40
40 -
 41
41 -
 42
42 -
 43
43 -
 44
44 -
 45
45 -
 46
46 -
 47
47 -
 48
48 -
 49
49 -
 50
50 -
 51
51 -
 52
52 -
 53
53 -
 54
54 -
 55
55 -
 56
56 -
57
-
58
-
59
-
60
-
61
-
62
-
63
-
64
-
65
-
66
-
67
-
68
-
69
-
70
-
71
-
72
-
73
-
74
-
75
-
76
-
77
-
78
-
79
-
80
-
81
-
82
-
83
-
84
-
85
-
86
-
87
-
88
-
89
-
90
-
91
-
92
-
93
-
94
 |
 |
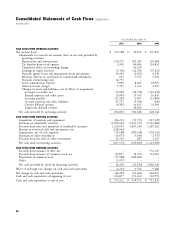
completed during 2003. The days sales outstanding metric and capital expenditures totaling approximately $52 mil-
(‘‘DSO’’) remained relatively flat in 2003 compared to lion. Cash used in investing activities increased from 2001
2002. Our customer profile is increasingly trending to 2002 primarily as a result of increased cash used for
toward a higher mix of advertising agency business, which acquisitions in 2002 compared to 2001, as well as net
traditionally carries longer payment terms, and therefore purchases of investments in 2002, compared to net pro-
we believe that DSO may increase in 2004 compared to ceeds from investments in 2001. Cash used in investing
2003. Deferred revenue balances also increased approxi- activities in 2001 of approximately $207 million was pri-
mately $33 million in 2003 compared to 2002, which marily attributable to cash used to secure restricted invest-
reflects growth in deferred revenue related to both the ments related to our leased facilities of approximately
legacy Yahoo! business and to acquisitions completed in $229 million, capital expenditures totaling approximately
2003. The increase in cash provided by operating activities $86 million and cash used in acquisitions and purchases
from 2002 to 2003 was primarily the result of higher net of other investments (net) of approximately $21 million,
income, which resulted from higher revenues and contin- partially offset by proceeds from sales and maturities (net
ued cost control efforts. Cash provided by operating activ- of purchases) of investments in marketable securities dur-
ities in 2002 of approximately $302 million consisted ing the year of approximately $129 million.
primarily of net income of approximately $43 million
Cash provided by financing activities in 2003 of $1.1 bil-
adjusted for non-cash items of approximately $221 mil-
lion was primarily due to proceeds from issuance of debt
lion and approximately $38 million provided by working
of $733 million and proceeds from the issuance of com-
capital and other activities. The increase from 2001 to
mon stock pursuant to stock option exercises of $353 mil-
2002 was primarily a result of net income in 2002 com-
lion. The debt matures in April 2008, unless converted
pared to net loss in 2001. Cash provided by operating
into Yahoo! common stock at a conversion price of
activities in 2001 of approximately $107 million consisted
$41.00 per share, subject to adjustment upon the occur-
primarily of a net loss of approximately $93 million
rence of certain events. Upon conversion, Yahoo! has the
adjusted for non-cash items of approximately $185 mil-
right to deliver cash in lieu of common stock. See
lion and approximately $15 million provided by working
Note 10 – ‘‘Long-Term Debt’’ in the Financial Statements
capital and other activities.
for further information related to the issuance of debt.
Cash used in investing activities in 2003 of approximately Cash provided by financing activities will be used for gen-
$1.1 billion was primarily attributable to purchases (net of eral corporate purposes, including potential future acquisi-
sales and maturities) of investments in marketable securi- tions or other transactions. Cash used in financing activi-
ties during the year of approximately $628 million, cash ties in 2002 of $22 million was primarily due to the
used in acquisitions and purchases of other investments repurchase of common stock of $100 million, offset by
(net of cash acquired) of $377 million, and capital proceeds from the issuance of common stock pursuant to
expenditures totaling approximately $117 million. Capital stock option exercises of $78 million. Cash provided by
expenditures have generally comprised purchases of com- financing activities in 2001 of $18 million was primarily
puter hardware, software, server equipment and furniture due to proceeds from the issuance of common stock pur-
and fixtures, and are expected to range from $160 million suant to stock option exercises of $84 million, offset by
to $190 million in 2004 as we invest in expansion of our common stock repurchases of $60 million and other
network and capabilities. Cash used in investing activities financing activities of $6 million. See Note 11 – ‘‘Stock-
increased from 2002 to 2003 primarily as a result of the holders’ Equity’’ in the Financial Statements for further
net purchases of marketable securities related to higher information related to the Company’s repurchase of com-
cash balances available for investing, as well as more cash mon stock.
used for acquisitions in 2003 compared to 2002. Cash
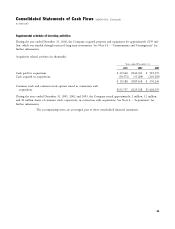
Operating Leases
used in investing activities in 2002 of approximately
$346 million was primarily attributable to cash used in During 1999, we entered into agreements for the develop-
acquisitions and purchases of other investments (net of ment of an office complex in Sunnyvale, California to
cash acquired) of approximately $196 million, purchases serve as our headquarters. Upon substantial completion of
(net of sales and maturities) of investments in marketable the construction in 2001, approximately $259 million was
securities during the year of approximately $98 million, funded for the complex in connection with the lease
40