Apple 2006 Annual Report Download - page 112
Download and view the complete annual report
Please find page 112 of the 2006 Apple annual report below. You can navigate through the pages in the report by either clicking on the pages listed below, or by using the keyword search tool below to find specific information within the annual report.-
 1
1 -
2
-
3
-
4
-
5
-
6
-
7
-
8
-
9
-
10
-
11
-
12
-
13
-
14
-
15
-
16
-
17
-
18
-
19
-
20
-
21
-
22
-
23
-
24
-
25
-
26
-
27
-
28
-
29
-
30
-
31
-
32
-
33
-
34
-
35
-
36
-
37
-
38
-
39
-
40
-
41
-
42
-
43
-
44
-
45
-
46
-
47
-
48
-
49
-
50
-
51
-
52
-
53
-
54
-
55
-
56
-
57
-
58
-
59
-
60
-
61
-
62
-
63
-
64
-
65
-
66
-
67
-
68
-
69
-
70
-
71
-
72
-
73
-
74
-
75
-
76
-
77
-
78
-
79
-
80
-
81
-
82
-
83
-
84
-
85
-
86
-
87
-
88
-
89
-
90
-
91
-
92
-
93
-
94
-
95
-
96
-
97
-
98
-
99
-
100
-
101
-
 102
102 -
 103
103 -
 104
104 -
 105
105 -
 106
106 -
 107
107 -
 108
108 -
 109
109 -
 110
110 -
 111
111 -
 112
112 -
 113
113 -
 114
114 -
 115
115 -
 116
116 -
 117
117 -
 118
118 -
 119
119 -
 120
120 -
 121
121 -
 122
122 -
123
-
124
-
125
-
126
-
127
-
128
-
129
-
130
-
131
-
132
-
133
-
134
-
135
-
136
-
137
-
138
-
139
-
140
-
141
-
142
-
143
 |
 |

NOTES TO CONSOLIDATED FINANCIAL STATEMENTS (Continued)
Note 11—Segment Information and Geographic Data (Continued)
from the operations of these stores were $33 million, $31 million, and $16 million for the years ended September 30, 2006, September 24,
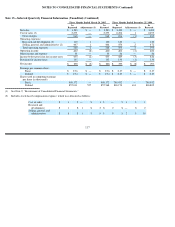
2005, and September 25, 2004, respectively.Summary information by operating segment follows (in millions):
(a)
The Americas asset figures do not include fixed assets held in the U.S. Such fixed assets are not allocated specifically to the
Americas segment and are included in the corporate assets figures below.
(b)
Retail segment depreciation and asset figures reflect the cost and related depreciation of its retail stores and related infrastructure.
Retail store construction-in-progress, which is not subject to depreciation, is reflected in corporate assets.
(c)
Other Segments include Asia-Pacific and FileMaker.
111
2006
2005
2004
Americas:
Net sales
$
9,307
$
6,590
$
4,019
Operating income
$
1,665
$
798
$
465
Depreciation, amortization, and accretion
$
6
$
6
$
6
Segment assets (a)
$
896
$
705
$
563
Europe:
Net sales
$
4,094
$
3,073
$
1,799
Operating income
$
607
$
454
$
280
Depreciation, amortization, and accretion
$
4
$
4
$
4
Segment assets
$
471
$
289
$
259
Japan:
Net sales
$
1,208
$
920
$
677
Operating income
$
201
$
140
$
115
Depreciation, amortization, and accretion
$
3
$
3
$
2
Segment assets
$
181
$
165
$
114
Retail:
Net sales
$
3,359
$
2,350
$
1,185
Operating income
$
198
$
151
$
39
Depreciation, amortization, and accretion (b)
$
59
$
43
$
35
Segment assets (b)
$
651
$
589
$
351
Other Segments (c):
Net sales
$
1,347
$
998
$
599
Operating income
$
235
$
118
$
90
Depreciation, amortization, and accretion
$
3
$
2
$
2
Segment assets
$
180
$
133
$
124