Apple 2006 Annual Report Download - page 58
Download and view the complete annual report
Please find page 58 of the 2006 Apple annual report below. You can navigate through the pages in the report by either clicking on the pages listed below, or by using the keyword search tool below to find specific information within the annual report.-
 1
1 -
2
-
3
-
4
-
5
-
6
-
7
-
8
-
9
-
10
-
11
-
12
-
13
-
14
-
15
-
16
-
17
-
18
-
19
-
20
-
21
-
22
-
23
-
24
-
25
-
26
-
27
-
28
-
29
-
30
-
31
-
32
-
33
-
34
-
35
-
36
-
37
-
38
-
39
-
40
-
41
-
42
-
43
-
44
-
45
-
46
-
47
-
 48
48 -
 49
49 -
 50
50 -
 51
51 -
 52
52 -
 53
53 -
 54
54 -
 55
55 -
 56
56 -
 57
57 -
 58
58 -
 59
59 -
 60
60 -
 61
61 -
 62
62 -
 63
63 -
 64
64 -
 65
65 -
 66
66 -
 67
67 -
 68
68 -
69
-
70
-
71
-
72
-
73
-
74
-
75
-
76
-
77
-
78
-
79
-
80
-
81
-
82
-
83
-
84
-
85
-
86
-
87
-
88
-
89
-
90
-
91
-
92
-
93
-
94
-
95
-
96
-
97
-
98
-
99
-
100
-
101
-
102
-
103
-
104
-
105
-
106
-
107
-
108
-
109
-
110
-
111
-
112
-
113
-
114
-
115
-
116
-
117
-
118
-
119
-
120
-
121
-
122
-
123
-
124
-
125
-
126
-
127
-
128
-
129
-
130
-
131
-
132
-
133
-
134
-
135
-
136
-
137
-
138
-
139
-
140
-
141
-
142
-
143
 |
 |

Middle East and Africa. The Retail segment operated Apple-owned retail stores in the U.S., Canada, Japan, and the U.K. during 2006. Each
reportable geographic operating segment provides similar hardware and software products and similar services. Further information regarding
the Company’s operating segments may be found in Note 11, “Segment Information and Geographic Data” in Notes to Consolidated Financial
Statements of this Form 10-K.
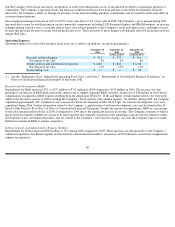
Americas
During 2006, net sales in the Americas segment increased $2.7 billion, or 41%, compared to 2005. The main factors for this increase were
significant increases in net sales of iPods, other music related products and services, Macintosh portable systems, and APP. Sales of iPods
increased primarily due to the introduction of the updated iPod with video-playing capabilities in October 2005 and the iPod nano during
September 2005. The increase in other music related products and services was due to increases in sales of Apple-branded and third-party iPod
accessories and sales from the iTunes Store. The increase in sales of Macintosh portable systems in the Americas was due to strong sales of the
Intel-based MacBook and MacBook Pro during 2006. The overall increase in net sales was partially offset by a decline in net sales of desktops,
displays, and Mac OS X. The decrease in desktop products and displays net sales reflects the overall shift in product mix toward portable
Macintosh systems. Mac OS X sales decreased from 2005 since the Company has not released a new version of Mac OS X since Tiger began
shipping in April 2005. During 2006, the Americas segment represented approximately 48% of the Company’s total net sales as compared to
47% in the same period of 2005. During 2006, U.S. education channel net sales and Macintosh unit sales increased by 13% and 11%,
respectively, compared to 2005. Net sales from the higher education market grew 22% during 2006 compared to 2005 due to strong sales of
Macintosh portable products and iPods. Net sales were relatively flat for K-12 due to continued budget constraints.
During 2005, net sales in the Americas segment grew 64% or $2.6 billion compared to 2004. The increase in net sales during 2005 was
primarily attributable to the significant year-over-year increase in iPod sales, sales of other music related products and services, and strong
sales of desktop and portable Macintosh systems. This increase was partially offset by a shift in sales to the Retail segment, which had 117
stores in the U.S. and Canada as of the end of 2005. Macintosh unit sales also increased by 30% in 2005 compared to 2004, driven primarily by
strong sales of desktop systems largely attributable to strong sales from the updated iMac, which began shipping in September 2004, and the
Mac mini, which was introduced in January 2005. During 2005 and 2004, the Americas segment represented approximately 47% and 49%,
respectively, of the Company’s total net sales and represented approximately 48% and 51%, respectively, of total Macintosh unit sales. The
Company experienced an increase in both U.S. education channel net sales and unit sales of 21% for 2005 compared to 2004. Strength in
higher education sales related primarily to strong iMac and portable system shipments. This strength drove year-over-year growth in net sales
of 32% for the higher education channel during 2005. Despite challenges in the K-12 market from continued budget constraints and
competitive pressures, the Company’s K-12 net sales grew year-over-year by 11% during 2005 due to increased iBook sales and 1:1 education
sales.
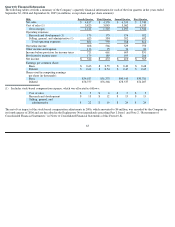
Europe
Europe segment net sales increased $1.0 billion or 33% during 2006 compared to 2005. Consistent with the Americas segment, these increases
were a result of strong growth in iPod sales, other music related products and services, and Macintosh portable systems. Sales of iPods
increased primarily due to the introduction of the updated iPod with video-playing capabilities in October 2005 and the iPod nano during
September 2005. The increase in other music related products and services was due to increases in sales of Apple-branded and third-party iPod
accessories and sales from the iTunes Store. The increase in sales of portable systems in Europe was due to strong sales of the Intel-based
MacBook and MacBook Pro that were introduced during 2006. In addition, Europe also reported increased sales in APP related to the increase
in Macintosh unit sales. These increases were partially offset by a decrease in desktop and
57