Apple 2006 Annual Report Download - page 62
Download and view the complete annual report
Please find page 62 of the 2006 Apple annual report below. You can navigate through the pages in the report by either clicking on the pages listed below, or by using the keyword search tool below to find specific information within the annual report.-
 1
1 -
2
-
3
-
4
-
5
-
6
-
7
-
8
-
9
-
10
-
11
-
12
-
13
-
14
-
15
-
16
-
17
-
18
-
19
-
20
-
21
-
22
-
23
-
24
-
25
-
26
-
27
-
28
-
29
-
30
-
31
-
32
-
33
-
34
-
35
-
36
-
37
-
38
-
39
-
40
-
41
-
42
-
43
-
44
-
45
-
46
-
47
-
48
-
49
-
50
-
51
-
 52
52 -
 53
53 -
 54
54 -
 55
55 -
 56
56 -
 57
57 -
 58
58 -
 59
59 -
 60
60 -
 61
61 -
 62
62 -
 63
63 -
 64
64 -
 65
65 -
 66
66 -
 67
67 -
 68
68 -
 69
69 -
 70
70 -
 71
71 -
 72
72 -
73
-
74
-
75
-
76
-
77
-
78
-
79
-
80
-
81
-
82
-
83
-
84
-
85
-
86
-
87
-
88
-
89
-
90
-
91
-
92
-
93
-
94
-
95
-
96
-
97
-
98
-
99
-
100
-
101
-
102
-
103
-
104
-
105
-
106
-
107
-
108
-
109
-
110
-
111
-
112
-
113
-
114
-
115
-
116
-
117
-
118
-
119
-
120
-
121
-
122
-
123
-
124
-
125
-
126
-
127
-
128
-
129
-
130
-
131
-
132
-
133
-
134
-
135
-
136
-
137
-
138
-
139
-
140
-
141
-
142
-
143
 |
 |

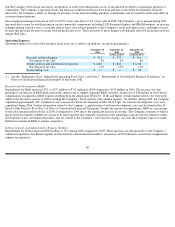
SG&A expense resulting from the adoption of SFAS No. 123R, a current year increase in discretionary spending on marketing and advertising,
higher direct and channel selling expenses resulting from the increase in net sales and employee salary merit increases, and the expenses
associated with the 14th week added to the first fiscal quarter of 2006 . Despite the increase in expenditures, SG&A as a percentage of total net
sales in 2006 remained flat as compared to 2005.
Expenditures for SG&A increased $434 million or 30% during 2005 compared to 2004. These increases are due primarily to the Company’s
continued expansion of its Retail segment in both domestic and international markets, a current year increase in discretionary spending on
marketing and advertising, and higher direct and channel selling expenses resulting from the increase in net sales and employee salary merit
increases. SG&A as a percentage of total net sales in 2005 was 13%, down from 17% in 2004, which is due to the increase in total net sales of
68% for the Company during 2005.
Fiscal 2004 Restructuring Actions
During 2004, the Company recorded total restructuring charges of approximately $23.0 million, including approximately $14.0 million in
severance costs, $5.5 million in asset impairments, and $3.5 million for lease cancellations. The lease cancellations relate to vacating a leased
sales facility as a result of a European workforce reduction during 2004. Of the $23.0 million charges, $21.3 million had been utilized by the
end of 2006, with the remainder consisting of $1.7 million for lease cancellations. These actions resulted in the termination of 452 positions.
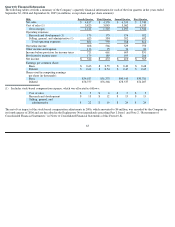
Other Income and Expense
Other income and expense for each of the last three fiscal years are as follows (in millions):
Gains and Losses on Non-current Investments
The Company previously held significant investments in ARM Holdings plc (ARM), Akamai Technologies, Inc. (Akamai), and EarthLink
Network, Inc. (EarthLink). T
he Company sold all of the remaining holdings in these non-current investments in 2004 and 2003. Pretax gains
recorded upon the sale of these non-current investments were $4 million in 2004.
Interest and Other Income, Net
Total interest and other income, net increased $200 million or 121% to $365 million during 2006 compared to $165 million in 2005 and $53
million in 2004. These increases are attributable primarily to higher cash and short-term investment balances and increasing investment yields
resulting from higher market interest rates and the 14th week added to the first fiscal quarter of 2006 . The weighted average interest rate
earned by the Company on its cash, cash equivalents, and short-term investments increased to 4.58% in 2006 compared to the 2.70% and
1.38% rates earned during 2005 and 2004, respectively. The current year increase in other income was partially offset by higher foreign
currency hedging expenses.
Interest expense in 2004 consisted primarily of interest on the Company’s $300 million aggregate principal amount unsecured notes, which
were repaid upon their maturity in February 2004. The unsecured notes
61
September 30,
September 24,
September 25,
2006
2005
2004
Gains on non-current investments, net
$
—
$
—
$
4
Interest income
$
394
$
183
$
64
Interest expense
—
—
(
3
)
Other income (expense), net
(29
)
(18
)
(8
)
Interest and other income, net
$
365
$
165
$
53
Total other income and expense
$
365
$
165
$
57