Apple 2006 Annual Report Download - page 118
Download and view the complete annual report
Please find page 118 of the 2006 Apple annual report below. You can navigate through the pages in the report by either clicking on the pages listed below, or by using the keyword search tool below to find specific information within the annual report.-
 1
1 -
2
-
3
-
4
-
5
-
6
-
7
-
8
-
9
-
10
-
11
-
12
-
13
-
14
-
15
-
16
-
17
-
18
-
19
-
20
-
21
-
22
-
23
-
24
-
25
-
26
-
27
-
28
-
29
-
30
-
31
-
32
-
33
-
34
-
35
-
36
-
37
-
38
-
39
-
40
-
41
-
42
-
43
-
44
-
45
-
46
-
47
-
48
-
49
-
50
-
51
-
52
-
53
-
54
-
55
-
56
-
57
-
58
-
59
-
60
-
61
-
62
-
63
-
64
-
65
-
66
-
67
-
68
-
69
-
70
-
71
-
72
-
73
-
74
-
75
-
76
-
77
-
78
-
79
-
80
-
81
-
82
-
83
-
84
-
85
-
86
-
87
-
88
-
89
-
90
-
91
-
92
-
93
-
94
-
95
-
96
-
97
-
98
-
99
-
100
-
101
-
102
-
103
-
104
-
105
-
106
-
107
-
 108
108 -
 109
109 -
 110
110 -
 111
111 -
 112
112 -
 113
113 -
 114
114 -
 115
115 -
 116
116 -
 117
117 -
 118
118 -
 119
119 -
 120
120 -
 121
121 -
 122
122 -
 123
123 -
 124
124 -
 125
125 -
 126
126 -
 127
127 -
 128
128 -
129
-
130
-
131
-
132
-
133
-
134
-
135
-
136
-
137
-
138
-
139
-
140
-
141
-
142
-
143
 |
 |

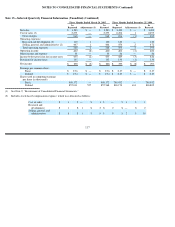
NOTES TO CONSOLIDATED FINANCIAL STATEMENTS (Continued)
Note 13—Selected Quarterly Financial Information (Unaudited) (Continued)
(1)
See Note 2, “Restatement of Consolidated Financial Statements.”
(2)
Includes stock-based compensation expense, which was allocated as follows:
117
Three Months Ended March 26, 2005
Three Months Ended December 25, 2004
As
Reported
Adjustments (1)
As
Restated
As
Reported
Adjustments (1)
As
Restated
Net sales
$
3,243
$
—
$
3,243
$
3,490
$
—
$
3,490
Cost of sales (2)
2,275
—
2,275
2,494
1
2,495
Gross margin
968
—
968
996
(1
)
995
Operating expenses:
Research and development (2)
119
1
120
123
—
123
Selling, general, and administrative (2)
447
1
448
470
2
472
Total operating expenses
566
2
568
593
2
595
Operating income
402
(2
)
400
403
(3
)
400
Other income and expense
33
—
33
26
—
26
Income before provision for income taxes
435
(2
)
433
429
(3
)
426
Provision for income taxes
145
—
145
134
(1
)
133
Net income
$
290
$
(2
)
$
288
$
295
$
(2
)
$
293
Earnings per common share:
Basic
$
0.36
$
—
$
0.36
$
0.37
$
—
$
0.37
Diluted
$
0.34
$
—
$
0.34
$
0.35
$
—
$
0.35
Shares used in computing earnings
per share (in thousands):
Basic
808,172
—
808,172
789,032
—
789,032
Diluted
857,011
557
857,568
838,174
631
838,805
Cost of sales
$
1
$
—
$
1
$
—
$
1
$
1
Research and
development
$
1
$
1
$
2
$
2
$
—
$
2
Selling, general, and
administrative
$
8
$
1
$
9
$
8
$
2
$
10