Apple 2006 Annual Report Download - page 61
Download and view the complete annual report
Please find page 61 of the 2006 Apple annual report below. You can navigate through the pages in the report by either clicking on the pages listed below, or by using the keyword search tool below to find specific information within the annual report.-
 1
1 -
2
-
3
-
4
-
5
-
6
-
7
-
8
-
9
-
10
-
11
-
12
-
13
-
14
-
15
-
16
-
17
-
18
-
19
-
20
-
21
-
22
-
23
-
24
-
25
-
26
-
27
-
28
-
29
-
30
-
31
-
32
-
33
-
34
-
35
-
36
-
37
-
38
-
39
-
40
-
41
-
42
-
43
-
44
-
45
-
46
-
47
-
48
-
49
-
50
-
 51
51 -
 52
52 -
 53
53 -
 54
54 -
 55
55 -
 56
56 -
 57
57 -
 58
58 -
 59
59 -
 60
60 -
 61
61 -
 62
62 -
 63
63 -
 64
64 -
 65
65 -
 66
66 -
 67
67 -
 68
68 -
 69
69 -
 70
70 -
 71
71 -
72
-
73
-
74
-
75
-
76
-
77
-
78
-
79
-
80
-
81
-
82
-
83
-
84
-
85
-
86
-
87
-
88
-
89
-
90
-
91
-
92
-
93
-
94
-
95
-
96
-
97
-
98
-
99
-
100
-
101
-
102
-
103
-
104
-
105
-
106
-
107
-
108
-
109
-
110
-
111
-
112
-
113
-
114
-
115
-
116
-
117
-
118
-
119
-
120
-
121
-
122
-
123
-
124
-
125
-
126
-
127
-
128
-
129
-
130
-
131
-
132
-
133
-
134
-
135
-
136
-
137
-
138
-
139
-
140
-
141
-
142
-
143
 |
 |

risk the Company will forecast incorrectly and produce or order from third-parties excess or insufficient inventories of particular products or
components. The Company’s operating results and financial condition in the past have been and may in the future be materially adversely
affected by the Company’s ability to manage its inventory levels and outstanding purchase commitments and to respond to short-term shifts in
customer demand patterns.
Gross margin percentage increased in 2005 to 29.0% of net sales from 27.3% of net sales in 2004. The Company’s gross margin during 2005
increased due to more favorable pricing on certain commodity components including LCD flat-
panel displays and DRAM memory; an increase
in higher margin software sales; a favorable shift in direct sales related primarily to the Company’s retail and online stores; and higher overall
revenue that provided for more leverage on fixed production costs. These increases to gross margin were partially offset by an increase in lower
margin iPod sales.
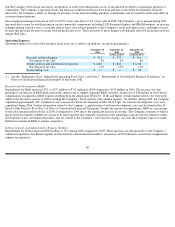
Operating Expenses
Operating expenses for each of the last three fiscal years are as follows (in millions, except for percentages):
(1)
See the “Explanatory Note” immediately preceding Part I, Item 1 and Note 2, “Restatement of Consolidated Financial Statements,” in
Notes to Consolidated Financial Statements of this Form 10-K.
Research and Development (R&D)
Expenditures for R&D increased 33% or $177 million to $712 million in 2006 compared to $535 million in 2005. The increase was due
primarily to an increase in R&D headcount in the current year to support expanded R&D activities, an increase of $46 million in stock-based
compensation recognized as R&D expense resulting from the adoption of SFAS No. 123R, and higher overall expenses due to the 14th week
added to the first fiscal quarter of 2006 to realign the Company’s fiscal quarters with calendar quarters . In addition, during 2005, the Company
capitalized approximately $29.7 million of costs associated with the development of Mac OS X Tiger. No software development costs were
capitalized during 2006. Further information related to the Company’s capitalization of software development costs may be found in Part II,
Item 8 of this Form 10-K at Note 1 of Notes to Consolidated Financial Statements. Despite the increase in expenditures, R&D as a percentage
of net sales remained relatively flat in 2006 as compared to 2005 due to the significant increase in revenue. The Company continues to believe
that focused investments in R&D are critical to its future growth and competitive position in the marketplace and are directly related to timely
development of new and enhanced products that are central to the Company’s core business strategy. As such, the Company expects to make
further investments in R&D to remain competitive.
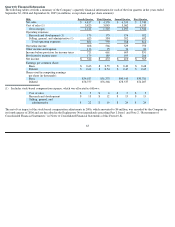
Selling, General, and Administrative Expense (SG&A)
Expenditures for SG&A increased $569 million or 31% during 2006 compared to 2005. These increases are due primarily to the Company’s
continued expansion of its Retail segment in both domestic and international markets, an increase of $50 million in stock-based compensation
expense recognized as
60
September 30,
September 24,
September 25,
2006
2005
2004
As Restated (1)
As Restated (1)
Research and development
$
712
$
535
$
491
Percentage of net sales
4
%
4
%
6
%
Selling, general, and administrative expenses
$
2,433
$
1,864
$
1,430
Percentage of net sales
13
%
13
%
17
%
Restructuring costs
$
—
$
—
$
23