Apple 2006 Annual Report Download - page 56
Download and view the complete annual report
Please find page 56 of the 2006 Apple annual report below. You can navigate through the pages in the report by either clicking on the pages listed below, or by using the keyword search tool below to find specific information within the annual report.-
 1
1 -
2
-
3
-
4
-
5
-
6
-
7
-
8
-
9
-
10
-
11
-
12
-
13
-
14
-
15
-
16
-
17
-
18
-
19
-
20
-
21
-
22
-
23
-
24
-
25
-
26
-
27
-
28
-
29
-
30
-
31
-
32
-
33
-
34
-
35
-
36
-
37
-
38
-
39
-
40
-
41
-
42
-
43
-
44
-
45
-
 46
46 -
 47
47 -
 48
48 -
 49
49 -
 50
50 -
 51
51 -
 52
52 -
 53
53 -
 54
54 -
 55
55 -
 56
56 -
 57
57 -
 58
58 -
 59
59 -
 60
60 -
 61
61 -
 62
62 -
 63
63 -
 64
64 -
 65
65 -
 66
66 -
67
-
68
-
69
-
70
-
71
-
72
-
73
-
74
-
75
-
76
-
77
-
78
-
79
-
80
-
81
-
82
-
83
-
84
-
85
-
86
-
87
-
88
-
89
-
90
-
91
-
92
-
93
-
94
-
95
-
96
-
97
-
98
-
99
-
100
-
101
-
102
-
103
-
104
-
105
-
106
-
107
-
108
-
109
-
110
-
111
-
112
-
113
-
114
-
115
-
116
-
117
-
118
-
119
-
120
-
121
-
122
-
123
-
124
-
125
-
126
-
127
-
128
-
129
-
130
-
131
-
132
-
133
-
134
-
135
-
136
-
137
-
138
-
139
-
140
-
141
-
142
-
143
 |
 |

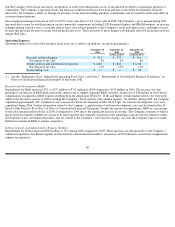
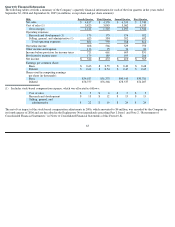
Fiscal Year 2006 versus 2005
Net sales during 2006 increased 39% or $5.4 billion from 2005. This increase was due in part to the fact that 2006 spanned 53 weeks while
2005 spanned 52 weeks. Several other factors contributed to these increases including the following:
•
Net sales of
iPods increased $3.1 billion or 69% during 2006 compared to 2005. Unit sales of iPods totaled 39.4 million in 2006, which
represents an increase of 75% from 22.5 million iPod units sold in 2005. Strong iPod sales during 2006 reflected significant sales of
both the hard-drive based iPod that supports video, first introduced in October of 2005 and the iPod nano, introduced in
September 2005, as well as continued expansion of iPod distribution points. During 2006, the net sales per iPod unit sold decreased by
3% compared to 2005 primarily due to an overall decrease in average selling prices for all iPods as well as a shift in product mix to the
iPod nano. From the introduction of the iPod in 2002 through 2006, the Company has sold approximately 68 million iPods.
•
Macintosh net sales increased $1.1 billion or 18% during 2006 compared to 2005. Macintosh unit sales increased by 769,000 units or
17% during 2006 compared to 2005. These increases were mainly due to strong demand for the Intel-based MacBook and MacBook
Pro systems and reflect a shift in product mix to portable products in all of the Company’s operating segments. Net sales and unit sales
of the Company’s portable products increased 43% and 42%, respectively, during 2006 compared to 2005. Macintosh desktop net sales
and unit sales both decreased by 3% during 2006 compared to 2005. The decrease in sales of the Company’s Macintosh desktops was
due to declines in sales of the Company’s professional-oriented desktop products. The Company believes the decline in the Company’s
professional-oriented desktop products was due to customers delaying purchases of such products in anticipation of the release of the
Intel-based Mac Pro, which did not begin shipping until August 2006, and updated software applications capable of running on Intel-
based Macintosh computers, and the trend toward portable computers. A slight increase of 1% during 2006 in net sales per Macintosh
unit sold was due to a shift in mix to higher-priced portable products, partially offset by price reductions on certain Macintosh systems.
•
Other music related products and services consists of sales associated with the iTunes Store and iPod services and accessories. Net
sales of other music related products and services increased $986 million or 110% during 2006 compared to 2005. The increase was
primarily due to increased net sales from the iTunes Store and Apple-branded and third-party iPod accessories and services. The
increase in sales from the iTunes Store stemmed from significant growth in U.S. sales and the opening of The iTunes Store in Japan
during August 2005 and Australia during October 2005. The increased sales from the iTunes Store were also attributable to the
availability of videos, television shows, and feature-length movie downloads.
•
Net sales of software, service, and other sales increased $188 million or 17% during 2006 compared to 2005. The growth was primarily
attributable to increased net sales of AppleCare Protection Plan (“APP”) extended service and support contracts and application
software, partially offset by a decrease in sales of Mac OS X. Mac OS X sales were particularly high in 2005 due to the release of Mac
OS X Tiger in April 2005.
Offsetting the favorable factors discussed above, the Company’s net sales during 2006 were negatively impacted by the following:
•
Net sales of peripherals and other hardware declined $26 million or 2% compared to 2005 primarily due to price decreases and a
decrease in net sales of displays relating to a shift in mix from desktop to portable systems. The decrease in net sales of displays for
2006 is consistent with the overall decrease in unit sales of Macintosh professional desktop systems.
55