Apple 2006 Annual Report Download - page 93
Download and view the complete annual report
Please find page 93 of the 2006 Apple annual report below. You can navigate through the pages in the report by either clicking on the pages listed below, or by using the keyword search tool below to find specific information within the annual report.-
 1
1 -
2
-
3
-
4
-
5
-
6
-
7
-
8
-
9
-
10
-
11
-
12
-
13
-
14
-
15
-
16
-
17
-
18
-
19
-
20
-
21
-
22
-
23
-
24
-
25
-
26
-
27
-
28
-
29
-
30
-
31
-
32
-
33
-
34
-
35
-
36
-
37
-
38
-
39
-
40
-
41
-
42
-
43
-
44
-
45
-
46
-
47
-
48
-
49
-
50
-
51
-
52
-
53
-
54
-
55
-
56
-
57
-
58
-
59
-
60
-
61
-
62
-
63
-
64
-
65
-
66
-
67
-
68
-
69
-
70
-
71
-
72
-
73
-
74
-
75
-
76
-
77
-
78
-
79
-
80
-
81
-
82
-
 83
83 -
 84
84 -
 85
85 -
 86
86 -
 87
87 -
 88
88 -
 89
89 -
 90
90 -
 91
91 -
 92
92 -
 93
93 -
 94
94 -
 95
95 -
 96
96 -
 97
97 -
 98
98 -
 99
99 -
 100
100 -
 101
101 -
 102
102 -
 103
103 -
104
-
105
-
106
-
107
-
108
-
109
-
110
-
111
-
112
-
113
-
114
-
115
-
116
-
117
-
118
-
119
-
120
-
121
-
122
-
123
-
124
-
125
-
126
-
127
-
128
-
129
-
130
-
131
-
132
-
133
-
134
-
135
-
136
-
137
-
138
-
139
-
140
-
141
-
142
-
143
 |
 |

NOTES TO CONSOLIDATED FINANCIAL STATEMENTS (Continued)
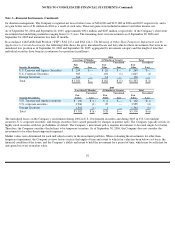
Note 3—Financial Instruments (Continued)
for duration management. The Company recognized net losses before taxes of $434,000 and $137,000 in 2006 and 2005, respectively, and a
net gain before taxes of $1 million in 2004 as a result of such sales. These net gains were included in interest and other income, net.
As of September 30, 2006 and September 24, 2005, approximately $921 million and $287 million, respectively, of the Company’s short-term
investments had underlying maturities ranging from 1 to 5 years. The remaining short-term investments as of September 30, 2006 and
September 24, 2005 had maturities less than 12 months.
In accordance with FASB Staff Position (“FSP”) FAS 115-1 and FAS 124-1, The Meaning of Other-Than-Temporary Impairment and Its
Application to Certain Investments,
the following table shows the gross unrealized losses and fair value for those investments that were in an
unrealized loss position as of September 30, 2006 and September 24, 2005, aggregated by investment category and the length of time that
individual securities have been in a continuous loss position (in millions):
The unrealized losses on the Company’s investments during 2006 in U.S. Government securities and during 2005 in U.S. Government
securities, U.S. corporate securities, and foreign securities were caused primarily by changes in interest rates. The Company typically invests in
highly-rated securities with low probabilities of default. The Company’s investment policy requires investments to be rated single-A or better.
Therefore, the Company considers the declines to be temporary in nature. As of September 30, 2006, the Company does not consider the
investments to be other-than-temporarily impaired.
Market values were determined for each individual security in the investment portfolio. When evaluating the investments for other-than-
temporary impairment, the Company reviews factors such as the length of time and extent to which fair value has been below cost basis, the
financial condition of the issuer, and the Company’s ability and intent to hold the investment for a period of time, which may be sufficient for
anticipated recovery in market value.
92
2006
Less than 12 Months
12 Months or Greater
Total
Security Description
Fair
Value
Unrealized
Loss
Fair
Value
Unrealized
Loss
Fair
Value
Unrealized
Loss
U.S. Treasury and Agency Securities
$
234
$
—
$
26
$
—
$
260
$
—
U.S. Corporate Securities
943
—
102
(1
)
1,045
(1
)
Foreign Securities
164
—
34
—
198
—
Total
$
1,341
$
—
$
162
$
(1
)
$
1,503
$
(1
)
2005
Less than 12 Months
12 Months or Greater
Total
Security Description
Fair
Value
Unrealized
Loss
Fair
Value
Unrealized
Loss
Fair
Value
Unrealized
Loss
U.S. Treasury and Agency securities
$
160
$
(1
)
$
2
$
—
$
162
$
(1
)
U.S. corporate securities
3,960
(4
)
25
—
3,985
(4
)
Foreign Securities
1,382
(1
)
1
—
1,383
(1
)
Total
$
5,502
$
(6
)
$
28
$
—
$
5,530
$
(6
)