Apple 2006 Annual Report Download - page 92
Download and view the complete annual report
Please find page 92 of the 2006 Apple annual report below. You can navigate through the pages in the report by either clicking on the pages listed below, or by using the keyword search tool below to find specific information within the annual report.-
 1
1 -
2
-
3
-
4
-
5
-
6
-
7
-
8
-
9
-
10
-
11
-
12
-
13
-
14
-
15
-
16
-
17
-
18
-
19
-
20
-
21
-
22
-
23
-
24
-
25
-
26
-
27
-
28
-
29
-
30
-
31
-
32
-
33
-
34
-
35
-
36
-
37
-
38
-
39
-
40
-
41
-
42
-
43
-
44
-
45
-
46
-
47
-
48
-
49
-
50
-
51
-
52
-
53
-
54
-
55
-
56
-
57
-
58
-
59
-
60
-
61
-
62
-
63
-
64
-
65
-
66
-
67
-
68
-
69
-
70
-
71
-
72
-
73
-
74
-
75
-
76
-
77
-
78
-
79
-
80
-
81
-
 82
82 -
 83
83 -
 84
84 -
 85
85 -
 86
86 -
 87
87 -
 88
88 -
 89
89 -
 90
90 -
 91
91 -
 92
92 -
 93
93 -
 94
94 -
 95
95 -
 96
96 -
 97
97 -
 98
98 -
 99
99 -
 100
100 -
 101
101 -
 102
102 -
103
-
104
-
105
-
106
-
107
-
108
-
109
-
110
-
111
-
112
-
113
-
114
-
115
-
116
-
117
-
118
-
119
-
120
-
121
-
122
-
123
-
124
-
125
-
126
-
127
-
128
-
129
-
130
-
131
-
132
-
133
-
134
-
135
-
136
-
137
-
138
-
139
-
140
-
141
-
142
-
143
 |
 |

NOTES TO CONSOLIDATED FINANCIAL STATEMENTS (Continued)
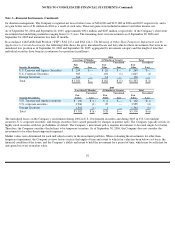
Note 2—Restatement of Consolidated Financial Statements (Continued)
The following table presents the cumulative adjustments of each component of shareholders’ equity at the end of each fiscal year (in millions):
Note 3—Financial Instruments
The carrying amounts of cash and cash equivalents, accounts receivable, accounts payable, and accrued expenses approximate their fair value
due to the short maturities of those instruments.
Cash, Cash Equivalents and Short-Term Investments
The following table summarizes the fair value of the Company’s cash and available-for-sale securities held in its short-term investment
portfolio, recorded as cash and cash equivalents or short-term investments (in millions):
The Company’s U.S. corporate securities consist primarily of commercial paper, certificates of deposit, time deposits, and corporate debt
securities. Foreign securities consist primarily of foreign commercial paper, certificates of deposit, and time deposits with foreign institutions,
most of which are denominated in U.S. dollars. The Company had net unrealized losses totaling $687,000 on its investment portfolio, primarily
related to investments with stated maturities less than 1 year, as of September 30, 2006, and net unrealized losses of $5.9 million on its
investment portfolio, approximately half of which related to investments with stated maturities less than 1 year, as of September 24, 2005. The
Company may sell its investments prior to their stated maturities for strategic purposes, in anticipation of credit deterioration, or
91
Fiscal Year
Common Stock
Deferred Stock
Compensation
Retained Earnings
Net Impact to
Shareholders
’
Equity
1998
$
26
$
(27
)
$
—
$
(
1
)
1999
36
(32
)
(6
)
(2
)
2000
56
(43
)
(15
)
(2
)
2001
81
(49
)
(28
)
4
2002
105
(49
)
(51
)
5
2003
85
(22
)
(63
)
—
2004
68
(8
)
(73
)
(13
)
2005
43
(1
)
(80
)
(38
)
September 30,
2006
September 24,
2005
Cash
$
200
$
127
U.S. Treasury and Agency securities
52
89
U.S. Corporate Securities
4,309
2,030
Foreign Securities
1,831
1,245
Total cash equivalents
6,192
3,364
U.S. Treasury and Agency securities
447
216
U.S. Corporate Securities
2,701
3,662
Foreign Securities
570
892
Total short-term investments
3,718
4,770
Total cash, cash equivalents, and short-term
investments
$
10,110
$
8,261