Apple 2006 Annual Report Download - page 116
Download and view the complete annual report
Please find page 116 of the 2006 Apple annual report below. You can navigate through the pages in the report by either clicking on the pages listed below, or by using the keyword search tool below to find specific information within the annual report.-
 1
1 -
2
-
3
-
4
-
5
-
6
-
7
-
8
-
9
-
10
-
11
-
12
-
13
-
14
-
15
-
16
-
17
-
18
-
19
-
20
-
21
-
22
-
23
-
24
-
25
-
26
-
27
-
28
-
29
-
30
-
31
-
32
-
33
-
34
-
35
-
36
-
37
-
38
-
39
-
40
-
41
-
42
-
43
-
44
-
45
-
46
-
47
-
48
-
49
-
50
-
51
-
52
-
53
-
54
-
55
-
56
-
57
-
58
-
59
-
60
-
61
-
62
-
63
-
64
-
65
-
66
-
67
-
68
-
69
-
70
-
71
-
72
-
73
-
74
-
75
-
76
-
77
-
78
-
79
-
80
-
81
-
82
-
83
-
84
-
85
-
86
-
87
-
88
-
89
-
90
-
91
-
92
-
93
-
94
-
95
-
96
-
97
-
98
-
99
-
100
-
101
-
102
-
103
-
104
-
105
-
 106
106 -
 107
107 -
 108
108 -
 109
109 -
 110
110 -
 111
111 -
 112
112 -
 113
113 -
 114
114 -
 115
115 -
 116
116 -
 117
117 -
 118
118 -
 119
119 -
 120
120 -
 121
121 -
 122
122 -
 123
123 -
 124
124 -
 125
125 -
 126
126 -
127
-
128
-
129
-
130
-
131
-
132
-
133
-
134
-
135
-
136
-
137
-
138
-
139
-
140
-
141
-
142
-
143
 |
 |

NOTES TO CONSOLIDATED FINANCIAL STATEMENTS (Continued)
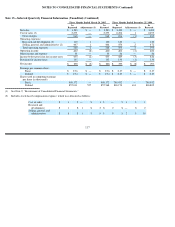
Note 13—Selected Quarterly Financial Information (Unaudited) (Continued)
income during the fourth quarter of 2006 benefited by $20 million due to the settlement of prior year tax audits in the U.S.
(1)
See Note 2, “Restatement of Consolidated Financial Statements.”
(2)
Includes stock-based compensation expense, which was allocated as follows:
The impact of the stock-based compensation adjustments was not significant to any of the interim balance sheets for fiscal year 2005.
Basic and diluted earnings per share are computed independently for each of the quarters presented. Therefore, the sum of quarterly basic and
diluted per share information may not equal annual basic and diluted earnings per share.
Net income during the fourth quarter of 2005 benefited by $81 million from the reversal of certain tax contingency reserves and adjustments to
net deferred tax assets, including reductions to valuation allowances.
115
2005
Fourth Quarter
Third Quarter
Second Quarter
First Quarter
As Restated (1)
As Restated (1)
As Restated (1)
As Restated (1)
Net sales
$
3,678
$
3,520
$
3,243
$
3,490
Cost of sales (2)
2,643
2,476
2,275
2,495
Gross margin
1,035
1,044
968
995
Operating expenses:
Research and development (2)
147
145
120
123
Selling, general, and administrative (2)
471
473
448
472
Total operating expenses
618
618
568
595
Operating income
417
426
400
400
Other income and expense
60
46
33
26
Income before provision for income taxes
477
472
433
426
Provision for income taxes
49
153
145
133
Net income
$
428
$
319
$
288
$
293
Earnings per common share:
Basic
$
0.52
$
0.39
$
0.36
$
0.37
Diluted
$
0.49
$
0.37
$
0.34
$
0.35
Shares used in computing earnings per share (in
thousands):
Basic
821,420
815,092
808,172
789,032
Diluted
866,483
860,803
857,568
838,805
Cost of sales
$
1
$
—
$
1
$
1
Research and development
$
1
$
2
$
2
$
2
Selling, general, and
administrative
$
10
$
10
$
9
$
10