Apple 2006 Annual Report Download - page 57
Download and view the complete annual report
Please find page 57 of the 2006 Apple annual report below. You can navigate through the pages in the report by either clicking on the pages listed below, or by using the keyword search tool below to find specific information within the annual report.-
 1
1 -
2
-
3
-
4
-
5
-
6
-
7
-
8
-
9
-
10
-
11
-
12
-
13
-
14
-
15
-
16
-
17
-
18
-
19
-
20
-
21
-
22
-
23
-
24
-
25
-
26
-
27
-
28
-
29
-
30
-
31
-
32
-
33
-
34
-
35
-
36
-
37
-
38
-
39
-
40
-
41
-
42
-
43
-
44
-
45
-
46
-
 47
47 -
 48
48 -
 49
49 -
 50
50 -
 51
51 -
 52
52 -
 53
53 -
 54
54 -
 55
55 -
 56
56 -
 57
57 -
 58
58 -
 59
59 -
 60
60 -
 61
61 -
 62
62 -
 63
63 -
 64
64 -
 65
65 -
 66
66 -
 67
67 -
68
-
69
-
70
-
71
-
72
-
73
-
74
-
75
-
76
-
77
-
78
-
79
-
80
-
81
-
82
-
83
-
84
-
85
-
86
-
87
-
88
-
89
-
90
-
91
-
92
-
93
-
94
-
95
-
96
-
97
-
98
-
99
-
100
-
101
-
102
-
103
-
104
-
105
-
106
-
107
-
108
-
109
-
110
-
111
-
112
-
113
-
114
-
115
-
116
-
117
-
118
-
119
-
120
-
121
-
122
-
123
-
124
-
125
-
126
-
127
-
128
-
129
-
130
-
131
-
132
-
133
-
134
-
135
-
136
-
137
-
138
-
139
-
140
-
141
-
142
-
143
 |
 |

Fiscal Year 2005 versus 2004
During 2005, net sales increased 68% or $5.7 billion from 2004. Several factors contributed favorably to net sales during 2005:
•
Net sales of iPods rose $3.2 billion or 248% during 2005 compared to 2004. Unit sales of iPods totaled 22.5 million in 2005, which
represented an increase of 409% from the 4.4 million iPod units sold in 2004. Strong sales of iPods during 2005 were experienced in all
of the Company’s operating segments and was driven by strong demand for the iPod shuffle introduced in January 2005, the release of
an updated version of the iPod mini in February 2005, the release of the iPod nano in September 2005, and expansion of the iPod’s
distribution network . Net sales per iPod unit sold decreased 32% primarily due to the introduction of the lower priced iPod shuffle in
January 2005 and iPod mini pricing reductions in February 2005. From the introduction of the iPod in 2002 through 2005, the Company
had sold approximately 28 million iPods.
•
Net sales of other music related products and services increased $621 million or 223% during 2005 compared to 2004. The Company
experienced strong growth in sales of iPod services and accessories consistent with the increase in overall iPod unit sales for 2005. The
increased sales from the iTunes Store were primarily due to substantial growth of net sales in the U.S. and expansion in Europe,
Canada, and Japan.
•
Total Macintosh net sales increased $1.4 billion or 27% during 2005 compared to 2004. Unit sales of Macintosh systems increased 1.2
million units or 38% during 2005 compared to 2004. The increases in Macintosh net sales and unit sales related primarily to strong
demand for the Company’s desktop products, which was experienced in all of the Company’s operating segments. The Company
believes that the success of the iPod had a positive impact on Macintosh net sales by introducing new customers to the Company’
s other
products. Desktop demand was stimulated in 2005 due to the iMac G5 and the introduction of the Mac mini in January 2005. Net sales
and unit sales of desktop products increased 45% and 55%, respectively, during 2005 compared to 2004. Macintosh net sales and unit
sales also included sales of the Company’s portable products, which increased 11% and 21%, respectively, compared to 2004.
Net sales per Macintosh unit sold decreased 7% on a year-over-year basis. The decrease was the result of changes in the overall unit
mix towards relatively lower-
priced consumer products, specifically the impact of the Mac mini product, and desktop and portable price
reductions. This decrease was partially offset by an increase in the proportion of direct sales.
•
Net sales of peripherals and other hardware rose by 18% during 2005 compared to 2004 primarily due to an increase in net sales of
displays and other computer accessories. Net sales of other hardware include AirPort cards and base stations, Xserve RAID storage,
iSight digital video cameras, and third-party hardware products.
•
Net sales of software, service and other sales rose $270 million or 33% during 2005 compared to 2004. This growth was primarily
attributable to increased net sales in APP extended service and support contracts, driven primarily by higher associated Macintosh
computer sales. Additionally, the Company experienced increases in net sales of .Mac Internet service, professional and consumer
applications, third-party software, and Mac OS X that was primarily attributable to the release of version 10.4 Tiger in April 2005.
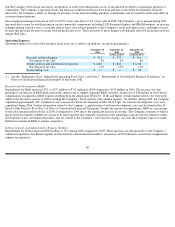
Segment Operating Performance
The Company manages its business primarily on a geographic basis. The Company’s reportable operating segments are comprised of the
Americas, Europe, Japan, and Retail. The Americas, Europe, and Japan reportable segments do not include activities related to the Retail
segment. The Americas segment includes both North and South America. The Europe segment includes European countries as well as the
56