Apple 2006 Annual Report Download - page 60
Download and view the complete annual report
Please find page 60 of the 2006 Apple annual report below. You can navigate through the pages in the report by either clicking on the pages listed below, or by using the keyword search tool below to find specific information within the annual report.-
 1
1 -
2
-
3
-
4
-
5
-
6
-
7
-
8
-
9
-
10
-
11
-
12
-
13
-
14
-
15
-
16
-
17
-
18
-
19
-
20
-
21
-
22
-
23
-
24
-
25
-
26
-
27
-
28
-
29
-
30
-
31
-
32
-
33
-
34
-
35
-
36
-
37
-
38
-
39
-
40
-
41
-
42
-
43
-
44
-
45
-
46
-
47
-
48
-
49
-
 50
50 -
 51
51 -
 52
52 -
 53
53 -
 54
54 -
 55
55 -
 56
56 -
 57
57 -
 58
58 -
 59
59 -
 60
60 -
 61
61 -
 62
62 -
 63
63 -
 64
64 -
 65
65 -
 66
66 -
 67
67 -
 68
68 -
 69
69 -
 70
70 -
71
-
72
-
73
-
74
-
75
-
76
-
77
-
78
-
79
-
80
-
81
-
82
-
83
-
84
-
85
-
86
-
87
-
88
-
89
-
90
-
91
-
92
-
93
-
94
-
95
-
96
-
97
-
98
-
99
-
100
-
101
-
102
-
103
-
104
-
105
-
106
-
107
-
108
-
109
-
110
-
111
-
112
-
113
-
114
-
115
-
116
-
117
-
118
-
119
-
120
-
121
-
122
-
123
-
124
-
125
-
126
-
127
-
128
-
129
-
130
-
131
-
132
-
133
-
134
-
135
-
136
-
137
-
138
-
139
-
140
-
141
-
142
-
143
 |
 |

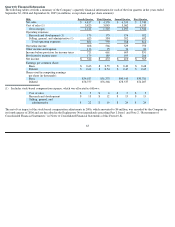
operating income of $39 million during 2004. This improvement was primarily attributable to the impact of opening new stores and the
segment’s year-over-year increase in average revenue per store, which resulted in higher leverage on occupancy, depreciation, and other fixed
costs.
Expansion of the Retail segment has required and will continue to require a substantial investment in fixed assets and related infrastructure,
operating lease commitments, personnel, and other operating expenses. Capital expenditures associated with the Retail segment were $200
million in 2006, bringing the total capital expenditures since inception of the Retail segment to approximately $729 million. As of
September 30, 2006, the Retail segment had approximately 5,787 employees and had outstanding operating lease commitments associated with
retail store space and related facilities of approximately $887 million. The Company would incur substantial costs if it were to close its retail
stores. Such costs could adversely affect the Company’s results of operations and financial condition.
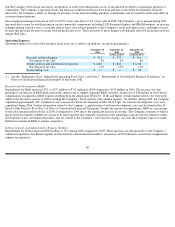
Gross Margin
Gross margin for each of the last three fiscal years are as follows (in millions, except gross margin percentages):
(1)
See the “Explanatory Note” immediately preceding Part I, Item 1 and Note 2, “Restatement of Consolidated Financial Statements” in
Notes to Consolidated Financial Statements of this Form 10-K.
Gross margin percentage of 29.0% in 2006 remained flat as compared to 2005. The Company experienced more favorable pricing on certain
commodity components including LCD flat-panel displays and DRAM memory and higher overall revenue that provided for more leverage on
fixed production costs, offset by an increase in lower margin iPod sales and other music-related services.
The Company anticipates that its gross margin and the gross margins of the personal computer and consumer electronics industries will be
under pressure due to price competition. The Company expects gross margin percentage to decline sequentially in the first quarter of 2007
primarily as a result of a shift in the mix of revenue toward lower margin products such as the iPod and content from the iTunes Store.
The foregoing statements regarding the Company’s expected gross margin percentage are forward-looking. There can be no assurance that
current gross margin percentage will be maintained or targeted gross margin percentage levels will be achieved. In general, gross margins and
margins on individual products, including iPods, will remain under significant downward pressure due to a variety of factors, including
continued industry wide global pricing pressures, increased competition, compressed product life cycles, potential increases in the cost and
availability of raw material and outside manufacturing services, and potential changes to the Company’s product mix, including higher unit
sales of consumer products with lower average selling prices and lower gross margins. In response to these competitive pressures, the
Company expects it will continue to take pricing actions with respect to its products. Gross margins could also be affected by the Company’s
ability to effectively manage product quality and warranty costs and to stimulate demand for certain of its products. Due to the Company’s
significant international operations, financial results can be significantly affected in the short-term by fluctuations in exchange rates.
The Company orders components for its products and builds inventory in advance of product shipments. Because the Company’s markets are
volatile and subject to rapid technology and price changes, there is a
59
September 30,
September 24,
September 25,
2006
2005
2004
As Restated (1)
As Restated (1)
Net sales
$
19,315
$
13,931
$
8,279
Cost of sales
13,717
9,889
6,022
Gross margin
$
5,598
$
4,042
$
2,257
Gross margin percentage
29.0
%
29.0
%
27.3
%