Apple 2006 Annual Report Download - page 113
Download and view the complete annual report
Please find page 113 of the 2006 Apple annual report below. You can navigate through the pages in the report by either clicking on the pages listed below, or by using the keyword search tool below to find specific information within the annual report.-
 1
1 -
2
-
3
-
4
-
5
-
6
-
7
-
8
-
9
-
10
-
11
-
12
-
13
-
14
-
15
-
16
-
17
-
18
-
19
-
20
-
21
-
22
-
23
-
24
-
25
-
26
-
27
-
28
-
29
-
30
-
31
-
32
-
33
-
34
-
35
-
36
-
37
-
38
-
39
-
40
-
41
-
42
-
43
-
44
-
45
-
46
-
47
-
48
-
49
-
50
-
51
-
52
-
53
-
54
-
55
-
56
-
57
-
58
-
59
-
60
-
61
-
62
-
63
-
64
-
65
-
66
-
67
-
68
-
69
-
70
-
71
-
72
-
73
-
74
-
75
-
76
-
77
-
78
-
79
-
80
-
81
-
82
-
83
-
84
-
85
-
86
-
87
-
88
-
89
-
90
-
91
-
92
-
93
-
94
-
95
-
96
-
97
-
98
-
99
-
100
-
101
-
102
-
 103
103 -
 104
104 -
 105
105 -
 106
106 -
 107
107 -
 108
108 -
 109
109 -
 110
110 -
 111
111 -
 112
112 -
 113
113 -
 114
114 -
 115
115 -
 116
116 -
 117
117 -
 118
118 -
 119
119 -
 120
120 -
 121
121 -
 122
122 -
 123
123 -
124
-
125
-
126
-
127
-
128
-
129
-
130
-
131
-
132
-
133
-
134
-
135
-
136
-
137
-
138
-
139
-
140
-
141
-
142
-
143
 |
 |

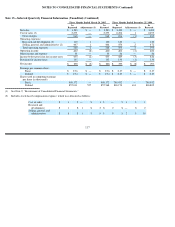
NOTES TO CONSOLIDATED FINANCIAL STATEMENTS (Continued)
Note 11—Segment Information and Geographic Data (Continued)
A reconciliation of the Company’s segment operating income and assets to the consolidated financial statements follows (in millions):
(1)
See Note 2, “Restatement of Consolidated Financial Statements.”
(a)
Represents the excess of the Retail segment’s cost of sales over the Company’s standard cost of sales for products sold through the
Retail segment.
(b)
Corporate expenses include research and development, corporate marketing expenses, manufacturing costs and variances not
included in standard costs, and other separately managed general and administrative expenses including certain corporate expenses
associated with support of the Retail segment.
No single customer accounted for more than 10% of net sales in 2006, 2005, or 2004. Net sales and long
-lived assets related to operations in
the U.S., Japan, and other foreign countries are as follows (in millions):
112
2006
2005
2004
As Restated (1)
As Restated (1)
Segment operating income
$
2,906
$
1,661
$
989
Retail manufacturing margin (a)
663
435
213
Other corporate expenses, net (b)
(953
)
(404
)
(820
)
Stock
-
based compensation expense
(163
)
(49
)
(46
)
Restructuring costs
—
—
(
23
)
Consolidated operating income
$
2,453
$
1,643
$
313
Segment assets
$
2,379
$
1,881
$
1,411
Corporate assets
14,826
9,635
6,628
Consolidated assets
$
17,205
$
11,516
$
8,039
Segment depreciation, amortization, and accretion
$
75
$
58
$
49
Corporate depreciation, amortization, and accretion
150
121
101
Consolidated depreciation, amortization, and accretion
$
225
$
179
$
150
2006
2005
2004
Net sales:
U.S.
$
11,486
$
8,194
$
4,893
Japan
1,327
1,021
738
Other countries
6,502
4,716
2,648
Total net sales
$
19,315
$
13,931
$
8,279
Long
-
lived assets:
U.S.
$
1,150
$
738
$
637
Japan
64
63
52
Other countries
154
112
72
Total long-lived assets
$
1,368
$
913
$
761