Apple 2006 Annual Report Download - page 115
Download and view the complete annual report
Please find page 115 of the 2006 Apple annual report below. You can navigate through the pages in the report by either clicking on the pages listed below, or by using the keyword search tool below to find specific information within the annual report.-
 1
1 -
2
-
3
-
4
-
5
-
6
-
7
-
8
-
9
-
10
-
11
-
12
-
13
-
14
-
15
-
16
-
17
-
18
-
19
-
20
-
21
-
22
-
23
-
24
-
25
-
26
-
27
-
28
-
29
-
30
-
31
-
32
-
33
-
34
-
35
-
36
-
37
-
38
-
39
-
40
-
41
-
42
-
43
-
44
-
45
-
46
-
47
-
48
-
49
-
50
-
51
-
52
-
53
-
54
-
55
-
56
-
57
-
58
-
59
-
60
-
61
-
62
-
63
-
64
-
65
-
66
-
67
-
68
-
69
-
70
-
71
-
72
-
73
-
74
-
75
-
76
-
77
-
78
-
79
-
80
-
81
-
82
-
83
-
84
-
85
-
86
-
87
-
88
-
89
-
90
-
91
-
92
-
93
-
94
-
95
-
96
-
97
-
98
-
99
-
100
-
101
-
102
-
103
-
104
-
 105
105 -
 106
106 -
 107
107 -
 108
108 -
 109
109 -
 110
110 -
 111
111 -
 112
112 -
 113
113 -
 114
114 -
 115
115 -
 116
116 -
 117
117 -
 118
118 -
 119
119 -
 120
120 -
 121
121 -
 122
122 -
 123
123 -
 124
124 -
 125
125 -
126
-
127
-
128
-
129
-
130
-
131
-
132
-
133
-
134
-
135
-
136
-
137
-
138
-
139
-
140
-
141
-
142
-
143
 |
 |

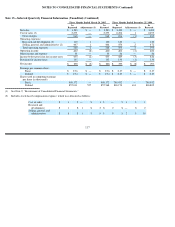
NOTES TO CONSOLIDATED FINANCIAL STATEMENTS (Continued)
Note 13—Selected Quarterly Financial Information (Unaudited)
The following tables set forth a summary of the Company’s quarterly financial information for each of the four quarters ended September 30,
2006 and September 24, 2005 (in millions, except share and per share amounts):
(1)
Includes stock-based compensation expense, which was allocated as follows:
The net of tax impact of the stock-based compensation adjustments in 2006, which amounted to $4 million, was recorded by the Company in
its fourth quarter of 2006 and is described in Note 2, “Restatement of Consolidated Financial Statements.”
Basic and diluted earnings per share are computed independently for each of the quarters presented. Therefore, the sum of quarterly basic and
diluted per share information may not equal annual basic and diluted earnings per share.
Net income during the third quarter of 2006 benefited by $20 million resulting from the dividend repatriation under the AJCA and international
tax planning strategies associated with the repatriation. Net
114
2006
Fourth Quarter
Third Quarter
Second Quarter
First Quarter
Net sales
$
4,837
$
4,370
$
4,359
$
5,749
Cost of sales (1)
3,425
3,045
3,062
4,185
Gross margin
1,412
1,325
1,297
1,564
Operating expenses:
Research and development (1)
179
175
176
182
Selling, general, and administrative (1)
625
584
592
632
Total operating expenses
804
759
768
814
Operating income
608
566
529
750
Other income and expense
113
95
76
81
Income before provision for income taxes
721
661
605
831
Provision for income taxes
179
189
195
266
Net income
$
542
$
472
$
410
$
565
Earnings per common share:
Basic
$
0.63
$
0.55
$
0.49
$
0.68
Diluted
$
0.62
$
0.54
$
0.47
$
0.65
Shares used in computing earnings per share (in
thousands):
Basic
854,187
851,375
840,910
830,781
Diluted
878,757
876,368
878,537
874,207
Cost of sales
$
5
$
6
$
5
$
5
Research and development
$
13
$
12
$
13
$
15
Selling, general, and administrative
$
22
$
19
$
24
$
24