Apple 2006 Annual Report Download - page 66
Download and view the complete annual report
Please find page 66 of the 2006 Apple annual report below. You can navigate through the pages in the report by either clicking on the pages listed below, or by using the keyword search tool below to find specific information within the annual report.-
 1
1 -
2
-
3
-
4
-
5
-
6
-
7
-
8
-
9
-
10
-
11
-
12
-
13
-
14
-
15
-
16
-
17
-
18
-
19
-
20
-
21
-
22
-
23
-
24
-
25
-
26
-
27
-
28
-
29
-
30
-
31
-
32
-
33
-
34
-
35
-
36
-
37
-
38
-
39
-
40
-
41
-
42
-
43
-
44
-
45
-
46
-
47
-
48
-
49
-
50
-
51
-
52
-
53
-
54
-
55
-
 56
56 -
 57
57 -
 58
58 -
 59
59 -
 60
60 -
 61
61 -
 62
62 -
 63
63 -
 64
64 -
 65
65 -
 66
66 -
 67
67 -
 68
68 -
 69
69 -
 70
70 -
 71
71 -
 72
72 -
 73
73 -
 74
74 -
 75
75 -
 76
76 -
77
-
78
-
79
-
80
-
81
-
82
-
83
-
84
-
85
-
86
-
87
-
88
-
89
-
90
-
91
-
92
-
93
-
94
-
95
-
96
-
97
-
98
-
99
-
100
-
101
-
102
-
103
-
104
-
105
-
106
-
107
-
108
-
109
-
110
-
111
-
112
-
113
-
114
-
115
-
116
-
117
-
118
-
119
-
120
-
121
-
122
-
123
-
124
-
125
-
126
-
127
-
128
-
129
-
130
-
131
-
132
-
133
-
134
-
135
-
136
-
137
-
138
-
139
-
140
-
141
-
142
-
143
 |
 |

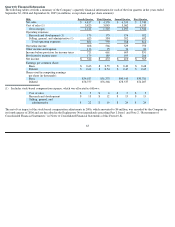
The following tables present the effects of adjustments made to the Company’
s previously reported quarterly financial information during 2005
(in millions, except per share amounts):
(1)
See the “Explanatory Note” immediately preceding Part I, Item 1 and Note 2, “Restatement of Consolidated Financial Statements,” in
Notes to Consolidated Financial Statements of this Form 10-K.
(2)
Includes stock-based compensation expense, which was allocated as follows:
65
Three Months Ended September 24, 2005
Three Months Ended June 25, 2005
As
Reported
Adjustments
(1)
As
Restated
As
Reported
Adjustments
(1)
As
Restated
Net sales
$
3,678
$
—
$
3,678
$
3,520
$
—
$
3,520
Cost of sales (2)
2,643
—
2,643
2,476
—
2,476
Gross margin
1,035
—
1,035
1,044
—
1,044
Operating expenses:
Research and development (2)
147
—
147
145
—
145
Selling, general, and
administrative (2)
470
1
471
472
1
473
Total operating expenses
617
1
618
617
1
618
Operating income
418
(1
)
417
427
(1
)
426
Other income and expense
60
—
60
46
—
46
Income before provision for
income taxes
478
(1
)
477
473
(1
)
472
Provision for income taxes
48
1
49
153
—
153
Net income
$
430
$
(2
)
$
428
$
320
$
(1
)
$
319
Earnings per common share:
Basic
$
0.52
$
—
$
0.52
$
0.39
$
—
$
0.39
Diluted
$
0.50
$
(0.01
)
$
0.49
$
0.37
$
—
$
0.37
Shares used in computing earnings per
share (in thousands):
Basic
821,420
—
821,420
815,092
—
815,092
Diluted
866,404
79
866,483
860,688
115
860,803
Cost of sales
$
1
$
—
$
1
$
—
$
—
$
—
Research and development
$
1
$
—
$
1
$
2
$
—
$
2
Selling, general, and
administrative
$
9
$
1
$
10
$
9
$
1
$
10