Apple 2006 Annual Report Download - page 55
Download and view the complete annual report
Please find page 55 of the 2006 Apple annual report below. You can navigate through the pages in the report by either clicking on the pages listed below, or by using the keyword search tool below to find specific information within the annual report.-
 1
1 -
2
-
3
-
4
-
5
-
6
-
7
-
8
-
9
-
10
-
11
-
12
-
13
-
14
-
15
-
16
-
17
-
18
-
19
-
20
-
21
-
22
-
23
-
24
-
25
-
26
-
27
-
28
-
29
-
30
-
31
-
32
-
33
-
34
-
35
-
36
-
37
-
38
-
39
-
40
-
41
-
42
-
43
-
44
-
 45
45 -
 46
46 -
 47
47 -
 48
48 -
 49
49 -
 50
50 -
 51
51 -
 52
52 -
 53
53 -
 54
54 -
 55
55 -
 56
56 -
 57
57 -
 58
58 -
 59
59 -
 60
60 -
 61
61 -
 62
62 -
 63
63 -
 64
64 -
 65
65 -
66
-
67
-
68
-
69
-
70
-
71
-
72
-
73
-
74
-
75
-
76
-
77
-
78
-
79
-
80
-
81
-
82
-
83
-
84
-
85
-
86
-
87
-
88
-
89
-
90
-
91
-
92
-
93
-
94
-
95
-
96
-
97
-
98
-
99
-
100
-
101
-
102
-
103
-
104
-
105
-
106
-
107
-
108
-
109
-
110
-
111
-
112
-
113
-
114
-
115
-
116
-
117
-
118
-
119
-
120
-
121
-
122
-
123
-
124
-
125
-
126
-
127
-
128
-
129
-
130
-
131
-
132
-
133
-
134
-
135
-
136
-
137
-
138
-
139
-
140
-
141
-
142
-
143
 |
 |

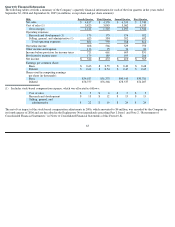
Net Sales
Net sales and Macintosh unit sales by operating segment and net sales and unit sales by product follow (net sales in millions and unit sales in
thousands):
Notes:
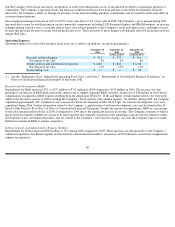
(a)
Other Segments include Asia Pacific and FileMaker.
(b)
Includes iMac, eMac, Mac mini, Mac Pro, Power Mac, and Xserve product lines.
(c)
Includes MacBook, iBook, MacBook Pro, and PowerBook product lines.
(d)
Consists of iTunes Store sales, iPod services, and Apple-branded and third-party iPod accessories.
(e)
Includes sales of Apple-branded and third-party displays, wireless connectivity and networking solutions, and other hardware accessories.
(f)
Includes sales of Apple-branded operating system, application software, third-party software, AppleCare, and Internet services.
(g)
Derived by dividing total Macintosh net sales by total Macintosh unit sales.
(h)
Derived by dividing total iPod net sales by total iPod unit sales.
54
September 30,
September 24,
September 25,
2006
Change
2005
Change
2004
Net Sales by Operating Segment:
Americas net sales
$
9,307
41
%
$
6,590
64
%
$
4,019
Europe net sales
4,094
33
%
3,073
71
%
1,799
Japan net sales
1,208
31
%
920
36
%
677
Retail net sales
3,359
43
%
2,350
98
%
1,185
Other Segments net sales (a)
1,347
35
%
998
67
%
599
Total net sales
$
19,315
39
%
$
13,931
68
%
$
8,279
Unit Sales by Operating Segment:
Americas Macintosh unit sales
2,432
11
%
2,184
30
%
1,682
Europe Macintosh unit sales
1,346
18
%
1,138
47
%
773
Japan Macintosh unit sales
304
(3
)%
313
8
%
291
Retail Macintosh unit sales
886
45
%
609
94
%
314
Other Segments Macintosh unit sales (a)
335
16
%
290
26
%
230
Total Macintosh unit sales
5,303
17
%
4,534
38
%
3,290
Net Sales by Product:
Desktops (b)
$
3,319
(3
)%
$
3,436
45
%
$
2,373
Portables (c)
4,056
43
%
2,839
11
%
2,550
Total Macintosh net sales
7,375
18
%
6,275
27
%
4,923
iPod
7,676
69
%
4,540
248
%
1,306
Other music related products and services (d)
1,885
110
%
899
223
%
278
Peripherals and other hardware (e)
1,100
(2
)%
1,126
18
%
951
Software, service, and other sales (f)
1,279
17
%
1,091
33
%
821
Total net sales
$
19,315
39
%
$
13,931
68
%
$
8,279
Unit Sales by Product:
Desktops (b)
2,434
(3
)%
2,520
55
%
1,625
Portables (c)
2,869
42
%
2,014
21
%
1,665
Total Macintosh unit sales
5,303
17
%
4,534
38
%
3,290
Net sales per Macintosh unit sold (g)
$
1,391
1
%
$
1,384
(7
)%
$
1,496
iPod unit sales
39,409
75
%
22,497
409
%
4,416
Net sales per iPod unit sold (h)
$
195
(3
)%
$
202
(32
)%
$
296