Coca Cola 2006 Annual Report Download - page 108
Download and view the complete annual report
Please find page 108 of the 2006 Coca Cola annual report below. You can navigate through the pages in the report by either clicking on the pages listed below, or by using the keyword search tool below to find specific information within the annual report.-
 1
1 -
2
-
3
-
4
-
5
-
6
-
7
-
8
-
9
-
10
-
11
-
12
-
13
-
14
-
15
-
16
-
17
-
18
-
19
-
20
-
21
-
22
-
23
-
24
-
25
-
26
-
27
-
28
-
29
-
30
-
31
-
32
-
33
-
34
-
35
-
36
-
37
-
38
-
39
-
40
-
41
-
42
-
43
-
44
-
45
-
46
-
47
-
48
-
49
-
50
-
51
-
52
-
53
-
54
-
55
-
56
-
57
-
58
-
59
-
60
-
61
-
62
-
63
-
64
-
65
-
66
-
67
-
68
-
69
-
70
-
71
-
72
-
73
-
74
-
75
-
76
-
77
-
78
-
79
-
80
-
81
-
82
-
83
-
84
-
85
-
86
-
87
-
88
-
89
-
90
-
91
-
92
-
93
-
94
-
95
-
96
-
97
-
 98
98 -
 99
99 -
 100
100 -
 101
101 -
 102
102 -
 103
103 -
 104
104 -
 105
105 -
 106
106 -
 107
107 -
 108
108 -
 109
109 -
 110
110 -
 111
111 -
 112
112 -
 113
113 -
 114
114 -
 115
115 -
 116
116 -
 117
117 -
 118
118 -
119
-
120
-
121
-
122
-
123
-
124
-
125
-
126
-
127
-
128
-
129
-
130
-
131
-
132
-
133
-
134
-
135
-
136
-
137
-
138
-
139
-
140
-
141
-
142
-
143
-
144
 |
 |

THE COCA-COLA COMPANY AND SUBSIDIARIES
NOTES TO CONSOLIDATED FINANCIAL STATEMENTS
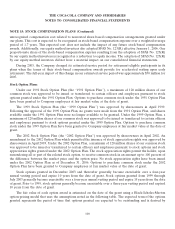
NOTE 15: STOCK COMPENSATION PLANS (Continued)
Of the outstanding granted performance share unit awards as of December 31, 2006, 590,964; 787,576; and
820,700 awards are for the 2004-2006, 2005-2007 and 2006-2008 performance periods, respectively. In addition,
72,000 performance share unit awards, with predefined qualitative performance criteria and release criteria that
differ from the program described above, were granted in 2004 and were outstanding as of December 31, 2006.
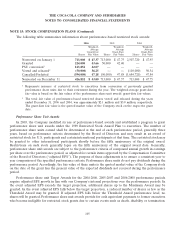
The following table summarizes information about performance share unit awards:
2006 2005 2004
Weighted- Weighted- Weighted-
Average Average Average
Share Grant-Date Share Grant-Date Share Grant-Date
Units Fair Value Units Fair Value Units Fair Value
Outstanding on January 1 2,356,728 $ 40.42 1,583,447 $ 41.83 798,931 $ 46.78
Granted 160,000 37.84 835,440 37.71 953,196 38.71
Converted to restricted stock1(123,852) 42.07 —— ——
Paid in cash equivalent2(7,178) 41.87 —— ——
Cancelled/Forfeited (114,458) 43.45 (62,159) 40.06 (168,680) 47.62
Outstanding on December 31 2,271,240 $ 39.99 2,356,728 $ 40.42 1,583,447 $ 41.83
1Represents performance share units converted to restricted stock for certain executives prior to
retirement. The vesting of this restricted stock is subject to certification of the applicable
performance periods.
2Represents share units that converted to cash equivalent payments to former executives who were
ineligible for restricted stock grants due to certain events such as death, disability or termination.
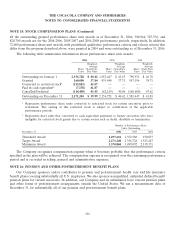
Number of Performance Share
Units Outstanding
December 31, 2006 2005 2004
Threshold Award 1,297,632 1,352,388 950,837
Target Award 2,271,240 2,356,728 1,583,447
Maximum Award 3,370,860 3,499,092 2,339,171
The Company recognizes compensation expense when it becomes probable that the performance criteria
specified in the plan will be achieved. The compensation expense is recognized over the remaining performance
period and is recorded in selling, general and administrative expenses.
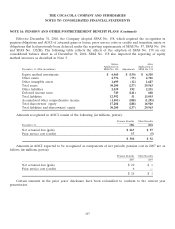
NOTE 16: PENSION AND OTHER POSTRETIREMENT BENEFIT PLANS
Our Company sponsors and/or contributes to pension and postretirement health care and life insurance
benefit plans covering substantially all U.S. employees. We also sponsor nonqualified, unfunded defined benefit
pension plans for certain associates. In addition, our Company and its subsidiaries have various pension plans
and other forms of postretirement arrangements outside the United States. We use a measurement date of
December 31 for substantially all of our pension and postretirement benefit plans.
106