Coca Cola 2006 Annual Report Download - page 86
Download and view the complete annual report
Please find page 86 of the 2006 Coca Cola annual report below. You can navigate through the pages in the report by either clicking on the pages listed below, or by using the keyword search tool below to find specific information within the annual report.-
 1
1 -
2
-
3
-
4
-
5
-
6
-
7
-
8
-
9
-
10
-
11
-
12
-
13
-
14
-
15
-
16
-
17
-
18
-
19
-
20
-
21
-
22
-
23
-
24
-
25
-
26
-
27
-
28
-
29
-
30
-
31
-
32
-
33
-
34
-
35
-
36
-
37
-
38
-
39
-
40
-
41
-
42
-
43
-
44
-
45
-
46
-
47
-
48
-
49
-
50
-
51
-
52
-
53
-
54
-
55
-
56
-
57
-
58
-
59
-
60
-
61
-
62
-
63
-
64
-
65
-
66
-
67
-
68
-
69
-
70
-
71
-
72
-
73
-
74
-
75
-
 76
76 -
 77
77 -
 78
78 -
 79
79 -
 80
80 -
 81
81 -
 82
82 -
 83
83 -
 84
84 -
 85
85 -
 86
86 -
 87
87 -
 88
88 -
 89
89 -
 90
90 -
 91
91 -
 92
92 -
 93
93 -
 94
94 -
 95
95 -
 96
96 -
97
-
98
-
99
-
100
-
101
-
102
-
103
-
104
-
105
-
106
-
107
-
108
-
109
-
110
-
111
-
112
-
113
-
114
-
115
-
116
-
117
-
118
-
119
-
120
-
121
-
122
-
123
-
124
-
125
-
126
-
127
-
128
-
129
-
130
-
131
-
132
-
133
-
134
-
135
-
136
-
137
-
138
-
139
-
140
-
141
-
142
-
143
-
144
 |
 |

THE COCA-COLA COMPANY AND SUBSIDIARIES
NOTES TO CONSOLIDATED FINANCIAL STATEMENTS
NOTE 3: BOTTLING INVESTMENTS (Continued)
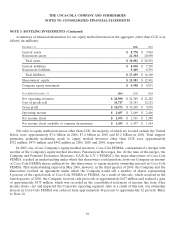
A summary of financial information for our equity method investees in the aggregate, other than CCE, is as
follows (in millions):
December 31, 2006 2005
Current assets $ 8,778 $ 7,803
Noncurrent assets 21,304 20,698
Total assets $ 30,082 $ 28,501
Current liabilities $ 8,030 $ 7,705
Noncurrent liabilities 9,469 8,395
Total liabilities $ 17,499 $ 16,100
Shareowners’ equity $ 12,583 $ 12,401
Company equity investment $ 4,998 $ 4,831
Year Ended December 31, 2006 2005 2004
Net operating revenues $ 24,990 $ 24,389 $ 21,202
Cost of goods sold 14,717 14,141 12,132
Gross profit $ 10,273 $ 10,248 $ 9,070
Operating income $ 2,697 $ 2,669 $ 2,406
Net income (loss) $ 1,475 $ 1,501 $ 1,389
Net income (loss) available to common shareowners $ 1,455 $ 1,477 $ 1,364
Net sales to equity method investees other than CCE, the majority of which are located outside the United
States, were approximately $7.6 billion in 2006, $7.4 billion in 2005 and $5.2 billion in 2004. Total support
payments, primarily marketing, made to equity method investees other than CCE were approximately
$512 million, $475 million and $442 million in 2006, 2005 and 2004, respectively.
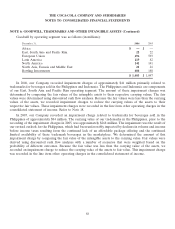
In 2003, one of our Company’s equity method investees, Coca-Cola FEMSA, consummated a merger with
another of the Company’s equity method investees, Panamerican Beverages, Inc. At the time of the merger, the
Company and Fomento Economico Mexicano, S.A.B. de C.V. (‘‘FEMSA’’), the major shareowner of Coca-Cola
FEMSA, reached an understanding under which this shareowner could purchase from our Company an amount
of Coca-Cola FEMSA shares sufficient for this shareowner to regain majority ownership interest in Coca-Cola
FEMSA. That understanding expired in May 2006; however, in the third quarter of 2006, the Company and the
shareowner reached an agreement under which the Company would sell a number of shares representing
8 percent of the capital stock of Coca-Cola FEMSA to FEMSA. As a result of this sale, which occurred in the
fourth quarter of 2006, the Company received cash proceeds of approximately $427 million and realized a gain
of approximately $175 million, which was recorded in the consolidated statement of income line item other
income (loss)—net and impacted the Corporate operating segment. Also as a result of this sale, our ownership
interest in Coca-Cola FEMSA was reduced from approximately 40 percent to approximately 32 percent. Refer
to Note 18.
84