Coca Cola 2006 Annual Report Download - page 59
Download and view the complete annual report
Please find page 59 of the 2006 Coca Cola annual report below. You can navigate through the pages in the report by either clicking on the pages listed below, or by using the keyword search tool below to find specific information within the annual report.-
 1
1 -
2
-
3
-
4
-
5
-
6
-
7
-
8
-
9
-
10
-
11
-
12
-
13
-
14
-
15
-
16
-
17
-
18
-
19
-
20
-
21
-
22
-
23
-
24
-
25
-
26
-
27
-
28
-
29
-
30
-
31
-
32
-
33
-
34
-
35
-
36
-
37
-
38
-
39
-
40
-
41
-
42
-
43
-
44
-
45
-
46
-
47
-
48
-
 49
49 -
 50
50 -
 51
51 -
 52
52 -
 53
53 -
 54
54 -
 55
55 -
 56
56 -
 57
57 -
 58
58 -
 59
59 -
 60
60 -
 61
61 -
 62
62 -
 63
63 -
 64
64 -
 65
65 -
 66
66 -
 67
67 -
 68
68 -
 69
69 -
70
-
71
-
72
-
73
-
74
-
75
-
76
-
77
-
78
-
79
-
80
-
81
-
82
-
83
-
84
-
85
-
86
-
87
-
88
-
89
-
90
-
91
-
92
-
93
-
94
-
95
-
96
-
97
-
98
-
99
-
100
-
101
-
102
-
103
-
104
-
105
-
106
-
107
-
108
-
109
-
110
-
111
-
112
-
113
-
114
-
115
-
116
-
117
-
118
-
119
-
120
-
121
-
122
-
123
-
124
-
125
-
126
-
127
-
128
-
129
-
130
-
131
-
132
-
133
-
134
-
135
-
136
-
137
-
138
-
139
-
140
-
141
-
142
-
143
-
144
 |
 |

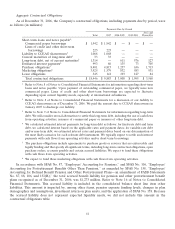
Based on current tax laws, the Company’s effective tax rate in 2007 is expected to be approximately
23 percent before considering the effect of any unusual or special items that may affect our tax rate in future
years.
Liquidity, Capital Resources and Financial Position
We believe our ability to generate cash from operating activities is one of our fundamental financial
strengths. We expect cash flows from operating activities to be strong in 2007 and in future years. Accordingly,
our Company expects to meet all of our financial commitments and operating needs for the foreseeable future.
We expect to use cash generated from operating activities primarily for dividends, share repurchases,
acquisitions and aggregate contractual obligations.
Cash Flows from Operating Activities
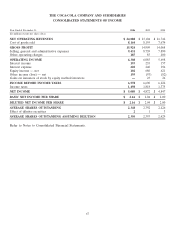
Net cash provided by operating activities for the years ended December 31, 2006, 2005 and 2004 was
approximately $6.0 billion, $6.4 billion and $6.0 billion, respectively.
Cash flows from operating activities decreased 7 percent in 2006 compared to 2005. This decrease was
primarily the result of payments in 2006 of marketing accruals recorded in 2005 related to increased marketing
and innovation activities and increased tax payments made in the first quarter of 2006 related to the 2005
repatriation of foreign earnings under the Jobs Creation Act. This decrease was partially offset by an increase in
cash receipts in 2006 from customers, which was driven by a 4 percent growth in net operating revenues. Our
cash flows from operating activities in 2006 also decreased versus 2005 as a result of a contribution of
approximately $216 million to a U.S. Voluntary Employee Beneficiary Association (‘‘VEBA’’), a tax-qualified
trust to fund retiree medical benefits (refer to Note 16 of Notes to Consolidated Financial Statements) and a
$100 million donation made to The Coca-Cola Foundation.
Cash flows from operating activities increased 8 percent in 2005 compared to 2004. The increase was
primarily related to an increase in cash receipts from customers, which was driven by a 6 percent growth in net
operating revenues. These higher cash collections were offset by increased payments to suppliers and vendors,
including payments related to our increased marketing spending. Our cash flows from operating activities in
2005 also improved versus 2004 as a result of a $137 million reduction in payments related to our 2003
streamlining initiatives. Cash flows from operating activities in 2005 were unfavorably impacted by a $176 million
increase in income tax payments primarily related to payment of a portion of the tax provision associated with
the repatriation of previously unremitted foreign earnings under the Jobs Creation Act.
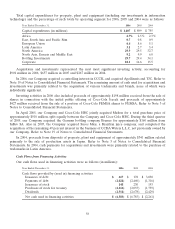
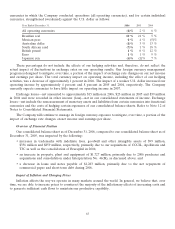
Cash Flows from Investing Activities
Our cash flows used in investing activities are summarized as follows (in millions):
Year Ended December 31, 2006 2005 2004
Cash flows (used in) provided by investing activities:
Acquisitions and investments, principally trademarks and
bottling companies $ (901) $ (637) $ (267)
Purchases of other investments (82) (53) (46)
Proceeds from disposals of other investments 640 33 161
Purchases of property, plant and equipment (1,407) (899) (755)
Proceeds from disposals of property, plant and equipment 112 88 341
Other investing activities (62) (28) 63
Net cash used in investing activities $ (1,700) $ (1,496) $ (503)
Purchases of property, plant and equipment accounted for the most significant cash outlays for investing
activities in each of the three years ended December 31, 2006. Our Company currently estimates that purchases
of property, plant and equipment in 2007 will be approximately $1.5 billion.
57