Coca Cola 2006 Annual Report Download - page 55
Download and view the complete annual report
Please find page 55 of the 2006 Coca Cola annual report below. You can navigate through the pages in the report by either clicking on the pages listed below, or by using the keyword search tool below to find specific information within the annual report.-
 1
1 -
2
-
3
-
4
-
5
-
6
-
7
-
8
-
9
-
10
-
11
-
12
-
13
-
14
-
15
-
16
-
17
-
18
-
19
-
20
-
21
-
22
-
23
-
24
-
25
-
26
-
27
-
28
-
29
-
30
-
31
-
32
-
33
-
34
-
35
-
36
-
37
-
38
-
39
-
40
-
41
-
42
-
43
-
44
-
 45
45 -
 46
46 -
 47
47 -
 48
48 -
 49
49 -
 50
50 -
 51
51 -
 52
52 -
 53
53 -
 54
54 -
 55
55 -
 56
56 -
 57
57 -
 58
58 -
 59
59 -
 60
60 -
 61
61 -
 62
62 -
 63
63 -
 64
64 -
 65
65 -
66
-
67
-
68
-
69
-
70
-
71
-
72
-
73
-
74
-
75
-
76
-
77
-
78
-
79
-
80
-
81
-
82
-
83
-
84
-
85
-
86
-
87
-
88
-
89
-
90
-
91
-
92
-
93
-
94
-
95
-
96
-
97
-
98
-
99
-
100
-
101
-
102
-
103
-
104
-
105
-
106
-
107
-
108
-
109
-
110
-
111
-
112
-
113
-
114
-
115
-
116
-
117
-
118
-
119
-
120
-
121
-
122
-
123
-
124
-
125
-
126
-
127
-
128
-
129
-
130
-
131
-
132
-
133
-
134
-
135
-
136
-
137
-
138
-
139
-
140
-
141
-
142
-
143
-
144
 |
 |
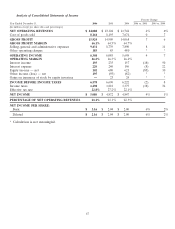
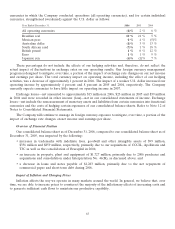
• In 2006, the increase in operating margin for the European Union was primarily due to a change in the
business model in Spain. Refer to the headings ‘‘Net Operating Revenues’’ and ‘‘Gross Profit,’’ above.
• In 2006, the decrease in operating income and operating margin for North Asia, Eurasia and Middle East
was primarily due to unfavorable product mix in Japan, which was partially offset by increased operating
income in Russia and Turkey. Operating margins in Japan are higher than the operating margins in
Russia and Turkey.
• In 2006, the increase in operating income and operating margin for Bottling Investments was primarily
due to price increases, favorable package mix and actions to improve efficiency.
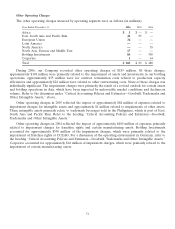
• In 2006, operating income was reduced by $100 million for Corporate as a result of a donation made to
The Coca-Cola Foundation.
• In 2005, operating income increased approximately 7 percent. Of this amount, 4 percent was due to
favorable foreign currency exchange primarily related to the Brazilian real and the Mexican peso, which
impacted Latin America and Bottling Investments, and the euro, which impacted the European Union
and Bottling Investments.
• In 2005, operating income was impacted by an increase in net operating revenues and gross profit,
partially offset by increased spending on marketing and innovation activities in each operating segment.
Refer to the headings ‘‘Net Operating Revenues’’ and ‘‘Selling, General and Administrative Expenses.’’
• In 2005, as a result of impairment charges totaling approximately $85 million related to the Philippines,
operating margins in the East, South Asia and Pacific Rim operating segment decreased. Refer to the
heading ‘‘Other Operating Charges.’’
• In 2005, operating income in Corporate decreased $146 million, primarily due to increased marketing
and innovation expenses, which were partially offset by our receipt of a net settlement of approximately
$47 million related to a class action lawsuit concerning the purchase of HFCS. Refer to the headings
‘‘Gross Profit’’ and ‘‘Selling, General and Administrative Expenses.’’
• In 2004, operating income was reduced by approximately $18 million for North America, $398 million for
Bottling Investments and $64 million for Corporate as a result of impairment charges. Refer to the
heading ‘‘Other Operating Charges.’’
• In 2004, operating income increased approximately 9 percent. Of this amount, 8 percent was due to
favorable foreign currency exchange primarily related to the euro, which impacted the European Union,
and the Japanese yen, which impacted North Asia, Eurasia and Middle East.
• In 2004, as a result of the creation of a nationally integrated supply chain management company in Japan,
operating margins in North Asia, Eurasia and Middle East increased. Effective October 1, 2003, the
Company and all of our bottling partners in Japan created a nationally integrated supply chain
management company to centralize procurement, production and logistics operations for the entire
Coca-Cola system in Japan. As a result, a portion of our Company’s business was essentially converted
from a finished product business model to a concentrate business model. This shift of certain products to
a concentrate business model resulted in reductions in our revenues and cost of goods sold, each in the
same amount. This change in the business model did not impact gross profit. Generally, concentrate and
syrup operations produce lower net revenues but higher operating margins compared to finished product
operations.
• In 2004, as a result of the consolidation of certain bottling operations that are considered variable interest
entities under Interpretation No. 46(R), operating margin for Bottling Investments was reduced.
Generally, bottling operations produce higher net revenues but lower operating margins compared to
concentrate and syrup operations.
53