Coca Cola 2006 Annual Report Download - page 52
Download and view the complete annual report
Please find page 52 of the 2006 Coca Cola annual report below. You can navigate through the pages in the report by either clicking on the pages listed below, or by using the keyword search tool below to find specific information within the annual report.-
 1
1 -
2
-
3
-
4
-
5
-
6
-
7
-
8
-
9
-
10
-
11
-
12
-
13
-
14
-
15
-
16
-
17
-
18
-
19
-
20
-
21
-
22
-
23
-
24
-
25
-
26
-
27
-
28
-
29
-
30
-
31
-
32
-
33
-
34
-
35
-
36
-
37
-
38
-
39
-
40
-
41
-
 42
42 -
 43
43 -
 44
44 -
 45
45 -
 46
46 -
 47
47 -
 48
48 -
 49
49 -
 50
50 -
 51
51 -
 52
52 -
 53
53 -
 54
54 -
 55
55 -
 56
56 -
 57
57 -
 58
58 -
 59
59 -
 60
60 -
 61
61 -
 62
62 -
63
-
64
-
65
-
66
-
67
-
68
-
69
-
70
-
71
-
72
-
73
-
74
-
75
-
76
-
77
-
78
-
79
-
80
-
81
-
82
-
83
-
84
-
85
-
86
-
87
-
88
-
89
-
90
-
91
-
92
-
93
-
94
-
95
-
96
-
97
-
98
-
99
-
100
-
101
-
102
-
103
-
104
-
105
-
106
-
107
-
108
-
109
-
110
-
111
-
112
-
113
-
114
-
115
-
116
-
117
-
118
-
119
-
120
-
121
-
122
-
123
-
124
-
125
-
126
-
127
-
128
-
129
-
130
-
131
-
132
-
133
-
134
-
135
-
136
-
137
-
138
-
139
-
140
-
141
-
142
-
143
-
144
 |
 |

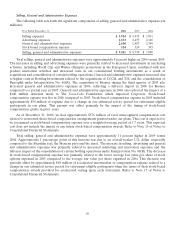
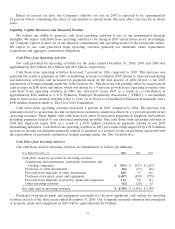
Selling, General and Administrative Expenses
The following table sets forth the significant components of selling, general and administrative expenses (in
millions):
Year Ended December 31, 2006 2005 2004
Selling expenses $ 3,924 $ 3,453 $ 3,031
Advertising expenses 2,553 2,475 2,165
General and administrative expenses 2,630 2,487 2,349
Stock-based compensation expense 324 324 345
Selling, general and administrative expenses $ 9,431 $ 8,739 $ 7,890
Total selling, general and administrative expenses were approximately 8 percent higher in 2006 versus 2005.
The increases in selling and advertising expenses were primarily related to increased investments in marketing
activities, including World Cup and Winter Olympics promotions in the European Union, combined with new
product innovation activities and increased costs in our consolidated bottling investments as a result of
acquisitions and consolidation of certain bottling operations. General and administrative expenses increased due
to higher costs in Bottling Investments related to the acquisitions of CCCIL and TJC and the consolidation of
Brucephil under Interpretation No. 46(R). The acquisition of Bremer during the third quarter of 2005 also
increased general and administrative expenses in 2006, reflecting a full-year impact in 2006 for Bremer
compared to a partial year in 2005. General and administrative expenses in 2006 also reflected the impact of a
$100 million donation made to The Coca-Cola Foundation, which impacted Corporate. Stock-based
compensation expense was flat in 2006 compared to 2005. Stock-based compensation expense in 2005 included
approximately $50 million of expense due to a change in our estimated service period for retirement-eligible
participants in our plans. This amount was offset primarily by the impact of the timing of stock-based
compensation grants in prior years.
As of December 31, 2006, we had approximately $376 million of total unrecognized compensation cost
related to nonvested share-based compensation arrangements granted under our plans. This cost is expected to
be recognized as stock-based compensation expense over a weighted-average period of 1.7 years. This expected
cost does not include the impact of any future stock-based compensation awards. Refer to Note 15 of Notes to
Consolidated Financial Statements.
Total selling, general and administrative expenses were approximately 11 percent higher in 2005 versus
2004. Approximately 1 percentage point of this increase was due to an overall weaker U.S. dollar (especially
compared to the Brazilian real, the Mexican peso and the euro). The increase in selling, advertising and general
and administrative expenses was primarily related to increased marketing and innovation expenses and the
full-year impact of the consolidation of certain bottling operations under Interpretation No. 46(R). The decrease
in stock-based compensation expense was primarily related to the lower average fair value per share of stock
options expensed in 2005 compared to the average fair value per share expensed in 2004. This decrease was
partially offset by approximately $50 million of accelerated amortization of compensation expense related to a
change in our estimated service period for retirement-eligible participants when the terms of their stock-based
compensation awards provided for accelerated vesting upon early retirement. Refer to Note 15 of Notes to
Consolidated Financial Statements.
50