Coca Cola 2006 Annual Report Download - page 123
Download and view the complete annual report
Please find page 123 of the 2006 Coca Cola annual report below. You can navigate through the pages in the report by either clicking on the pages listed below, or by using the keyword search tool below to find specific information within the annual report.-
 1
1 -
2
-
3
-
4
-
5
-
6
-
7
-
8
-
9
-
10
-
11
-
12
-
13
-
14
-
15
-
16
-
17
-
18
-
19
-
20
-
21
-
22
-
23
-
24
-
25
-
26
-
27
-
28
-
29
-
30
-
31
-
32
-
33
-
34
-
35
-
36
-
37
-
38
-
39
-
40
-
41
-
42
-
43
-
44
-
45
-
46
-
47
-
48
-
49
-
50
-
51
-
52
-
53
-
54
-
55
-
56
-
57
-
58
-
59
-
60
-
61
-
62
-
63
-
64
-
65
-
66
-
67
-
68
-
69
-
70
-
71
-
72
-
73
-
74
-
75
-
76
-
77
-
78
-
79
-
80
-
81
-
82
-
83
-
84
-
85
-
86
-
87
-
88
-
89
-
90
-
91
-
92
-
93
-
94
-
95
-
96
-
97
-
98
-
99
-
100
-
101
-
102
-
103
-
104
-
105
-
106
-
107
-
108
-
109
-
110
-
111
-
112
-
 113
113 -
 114
114 -
 115
115 -
 116
116 -
 117
117 -
 118
118 -
 119
119 -
 120
120 -
 121
121 -
 122
122 -
 123
123 -
 124
124 -
 125
125 -
 126
126 -
 127
127 -
 128
128 -
 129
129 -
 130
130 -
 131
131 -
 132
132 -
 133
133 -
134
-
135
-
136
-
137
-
138
-
139
-
140
-
141
-
142
-
143
-
144
 |
 |
THE COCA-COLA COMPANY AND SUBSIDIARIES
NOTES TO CONSOLIDATED FINANCIAL STATEMENTS
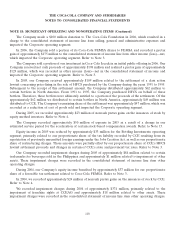
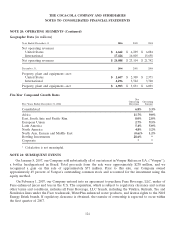
NOTE 19: ACQUISITIONS AND INVESTMENTS (Continued)
investment in Multon is accounted for under the equity method. Equity income—net includes our proportionate
share of the results of Multon’s operations beginning April 20, 2005.
During 2004, our Company’s acquisition and investment activity totaled approximately $267 million,
primarily related to the purchase of trademarks, brands and related contractual rights in Latin America, none of
which was individually significant.
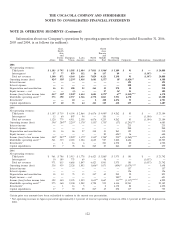
NOTE 20: OPERATING SEGMENTS
During 2006, the Company made certain changes to its operating structure, primarily to establish a separate
internal organization for its consolidated bottling operations and its unconsolidated bottling investments. This
structure resulted in the reporting of a Bottling Investments operating segment, along with the six existing
geographic operating segments and Corporate, beginning with the first quarter of 2006. Prior to this change in
the operating structure, the financial results of the consolidated bottling operations and our proportionate share
of the earnings of unconsolidated bottling operations had been generally included in the geographic operating
segments in which they conducted business. As of December 31, 2006, our Company’s operating structure
consisted of the following operating segments: Africa; East, South Asia and Pacific Rim; European Union; Latin
America; North America; North Asia, Eurasia and Middle East; Bottling Investments; and Corporate.
Prior-year amounts have been reclassified to conform to the new operating structure described above.
Segment Products and Services
The business of our Company is nonalcoholic beverages. Our operating segments derive a majority of their
revenues from the manufacture and sale of beverage concentrates and syrups and, in some cases, the sale of
finished beverages.
Method of Determining Segment Income or Loss
Management evaluates the performance of our operating segments separately to individually monitor the
different factors affecting financial performance. Our Company manages income taxes and financial costs, such
as interest income and expense, on a global basis within the Corporate operating segment. We evaluate segment
performance based on income or loss before income taxes.
121