Coca Cola 2006 Annual Report Download - page 60
Download and view the complete annual report
Please find page 60 of the 2006 Coca Cola annual report below. You can navigate through the pages in the report by either clicking on the pages listed below, or by using the keyword search tool below to find specific information within the annual report.-
 1
1 -
2
-
3
-
4
-
5
-
6
-
7
-
8
-
9
-
10
-
11
-
12
-
13
-
14
-
15
-
16
-
17
-
18
-
19
-
20
-
21
-
22
-
23
-
24
-
25
-
26
-
27
-
28
-
29
-
30
-
31
-
32
-
33
-
34
-
35
-
36
-
37
-
38
-
39
-
40
-
41
-
42
-
43
-
44
-
45
-
46
-
47
-
48
-
49
-
 50
50 -
 51
51 -
 52
52 -
 53
53 -
 54
54 -
 55
55 -
 56
56 -
 57
57 -
 58
58 -
 59
59 -
 60
60 -
 61
61 -
 62
62 -
 63
63 -
 64
64 -
 65
65 -
 66
66 -
 67
67 -
 68
68 -
 69
69 -
 70
70 -
71
-
72
-
73
-
74
-
75
-
76
-
77
-
78
-
79
-
80
-
81
-
82
-
83
-
84
-
85
-
86
-
87
-
88
-
89
-
90
-
91
-
92
-
93
-
94
-
95
-
96
-
97
-
98
-
99
-
100
-
101
-
102
-
103
-
104
-
105
-
106
-
107
-
108
-
109
-
110
-
111
-
112
-
113
-
114
-
115
-
116
-
117
-
118
-
119
-
120
-
121
-
122
-
123
-
124
-
125
-
126
-
127
-
128
-
129
-
130
-
131
-
132
-
133
-
134
-
135
-
136
-
137
-
138
-
139
-
140
-
141
-
142
-
143
-
144
 |
 |

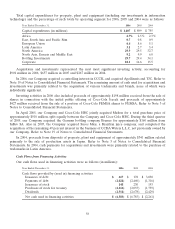
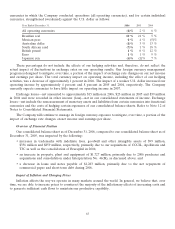
Total capital expenditures for property, plant and equipment (including our investments in information
technology) and the percentage of such totals by operating segment for 2006, 2005 and 2004 were as follows:
Year Ended December 31, 2006 2005 2004
Capital expenditures (in millions) $ 1,407 $ 899 $ 755
Africa 2.7% 2.5% 2.3%
East, South Asia and Pacific Rim 0.7 0.8 0.9
European Union 6.6 8.6 5.1
Latin America 3.1 2.7 3.4
North America 29.9 29.5 32.7
North Asia, Eurasia and Middle East 9.2 9.9 6.0
Bottling Investments 29.7 29.4 34.1
Corporate 18.1 16.6 15.5
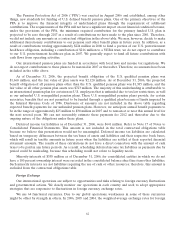
Acquisitions and investments represented the next most significant investing activity, accounting for
$901 million in 2006, $637 million in 2005 and $267 million in 2004.
In 2006, our Company acquired a controlling interest in CCCIL and acquired Apollinaris and TJC. Refer to
Note 19 of Notes to Consolidated Financial Statements. The remaining amount of cash used for acquisitions and
investments was primarily related to the acquisition of various trademarks and brands, none of which were
individually significant.
Investing activities in 2006 also included proceeds of approximately $198 million received from the sale of
shares in connection with the initial public offering of Coca-Cola Icecek and proceeds of approximately
$427 million received from the sale of a portion of Coca-Cola FEMSA shares to FEMSA. Refer to Note 3 of
Notes to Consolidated Financial Statements.
In April 2005, our Company and Coca-Cola HBC jointly acquired Multon for a total purchase price of
approximately $501 million, split equally between the Company and Coca-Cola HBC. During the third quarter
of 2005, our Company acquired the German bottling company Bremer for approximately $160 million from
InBev SA. Also in 2005, the Company acquired Sucos Mais, a Brazilian juice company, and completed the
acquisition of the remaining 49 percent interest in the business of CCDA Waters L.L.C. not previously owned by
our Company. Refer to Note 19 of Notes to Consolidated Financial Statements.
In 2004, proceeds from disposals of property, plant and equipment of approximately $341 million related
primarily to the sale of production assets in Japan. Refer to Note 3 of Notes to Consolidated Financial
Statements. In 2004, cash payments for acquisitions and investments were primarily related to the purchase of
trademarks in Latin America.
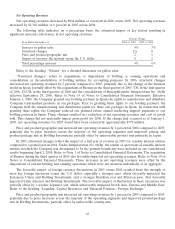
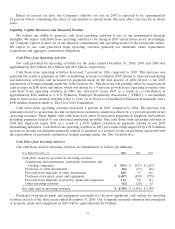
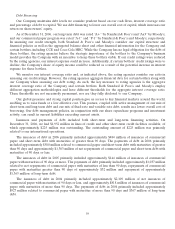
Cash Flows from Financing Activities
Our cash flows used in financing activities were as follows (in millions):
Year Ended December 31, 2006 2005 2004
Cash flows provided by (used in) financing activities:
Issuances of debt $ 617 $ 178 $ 3,030
Payments of debt (2,021) (2,460) (1,316)
Issuances of stock 148 230 193
Purchases of stock for treasury (2,416) (2,055) (1,739)
Dividends (2,911) (2,678) (2,429)
Net cash used in financing activities $ (6,583) $ (6,785) $ (2,261)
58