Coca Cola 2006 Annual Report Download - page 94
Download and view the complete annual report
Please find page 94 of the 2006 Coca Cola annual report below. You can navigate through the pages in the report by either clicking on the pages listed below, or by using the keyword search tool below to find specific information within the annual report.-
 1
1 -
2
-
3
-
4
-
5
-
6
-
7
-
8
-
9
-
10
-
11
-
12
-
13
-
14
-
15
-
16
-
17
-
18
-
19
-
20
-
21
-
22
-
23
-
24
-
25
-
26
-
27
-
28
-
29
-
30
-
31
-
32
-
33
-
34
-
35
-
36
-
37
-
38
-
39
-
40
-
41
-
42
-
43
-
44
-
45
-
46
-
47
-
48
-
49
-
50
-
51
-
52
-
53
-
54
-
55
-
56
-
57
-
58
-
59
-
60
-
61
-
62
-
63
-
64
-
65
-
66
-
67
-
68
-
69
-
70
-
71
-
72
-
73
-
74
-
75
-
76
-
77
-
78
-
79
-
80
-
81
-
82
-
83
-
 84
84 -
 85
85 -
 86
86 -
 87
87 -
 88
88 -
 89
89 -
 90
90 -
 91
91 -
 92
92 -
 93
93 -
 94
94 -
 95
95 -
 96
96 -
 97
97 -
 98
98 -
 99
99 -
 100
100 -
 101
101 -
 102
102 -
 103
103 -
 104
104 -
105
-
106
-
107
-
108
-
109
-
110
-
111
-
112
-
113
-
114
-
115
-
116
-
117
-
118
-
119
-
120
-
121
-
122
-
123
-
124
-
125
-
126
-
127
-
128
-
129
-
130
-
131
-
132
-
133
-
134
-
135
-
136
-
137
-
138
-
139
-
140
-
141
-
142
-
143
-
144
 |
 |
THE COCA-COLA COMPANY AND SUBSIDIARIES
NOTES TO CONSOLIDATED FINANCIAL STATEMENTS
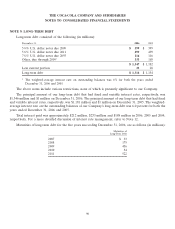
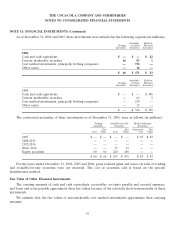
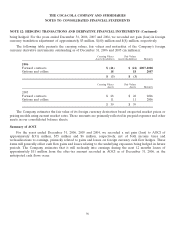
NOTE 11: FINANCIAL INSTRUMENTS
Certain Debt and Marketable Equity Securities
Investments in debt and marketable equity securities, other than investments accounted for by the equity
method, are categorized as trading, available-for-sale or held-to-maturity. Our marketable equity investments
are categorized as trading or available-for-sale with their cost basis determined by the specific identification
method. Trading securities are carried at fair value with realized and unrealized gains and losses included in net
income. We record available-for-sale instruments at fair value, with unrealized gains and losses, net of deferred
income taxes, reported as a component of AOCI. Debt securities categorized as held-to-maturity are stated at
amortized cost.
As of December 31, 2006 and 2005, trading, available-for-sale and held-to-maturity securities consisted of
the following (in millions):
Gross Unrealized Estimated
Cost Gains Losses Fair Value
2006
Trading Securities:
Equity securities $60 $ 6 $— $66
Available-for-sale securities:
Equity securities $ 240 $ 219 $ (1) $ 458
Other securities 13 — — 13
$ 253 $ 219 $ (1) $ 471
Held-to-maturity securities:
Bank and corporate debt $83$—$— $83
Gross Unrealized Estimated
Cost Gains Losses Fair Value
2005
Trading Securities:
Equity securities $ — $ — $ — $ —
Available-for-sale securities:
Equity securities $ 138 $ 167 $ (2) $ 303
Other securities 13 — — 13
$ 151 $ 167 $ (2) $ 316
Held-to-maturity securities:
Bank and corporate debt $ 348 $ — $ — $ 348
92