Coca Cola 2006 Annual Report Download - page 126
Download and view the complete annual report
Please find page 126 of the 2006 Coca Cola annual report below. You can navigate through the pages in the report by either clicking on the pages listed below, or by using the keyword search tool below to find specific information within the annual report.-
 1
1 -
2
-
3
-
4
-
5
-
6
-
7
-
8
-
9
-
10
-
11
-
12
-
13
-
14
-
15
-
16
-
17
-
18
-
19
-
20
-
21
-
22
-
23
-
24
-
25
-
26
-
27
-
28
-
29
-
30
-
31
-
32
-
33
-
34
-
35
-
36
-
37
-
38
-
39
-
40
-
41
-
42
-
43
-
44
-
45
-
46
-
47
-
48
-
49
-
50
-
51
-
52
-
53
-
54
-
55
-
56
-
57
-
58
-
59
-
60
-
61
-
62
-
63
-
64
-
65
-
66
-
67
-
68
-
69
-
70
-
71
-
72
-
73
-
74
-
75
-
76
-
77
-
78
-
79
-
80
-
81
-
82
-
83
-
84
-
85
-
86
-
87
-
88
-
89
-
90
-
91
-
92
-
93
-
94
-
95
-
96
-
97
-
98
-
99
-
100
-
101
-
102
-
103
-
104
-
105
-
106
-
107
-
108
-
109
-
110
-
111
-
112
-
113
-
114
-
115
-
 116
116 -
 117
117 -
 118
118 -
 119
119 -
 120
120 -
 121
121 -
 122
122 -
 123
123 -
 124
124 -
 125
125 -
 126
126 -
 127
127 -
 128
128 -
 129
129 -
 130
130 -
 131
131 -
 132
132 -
 133
133 -
 134
134 -
 135
135 -
 136
136 -
137
-
138
-
139
-
140
-
141
-
142
-
143
-
144
 |
 |

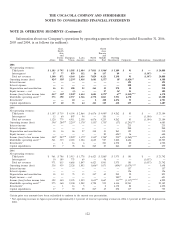
THE COCA-COLA COMPANY AND SUBSIDIARIES
NOTES TO CONSOLIDATED FINANCIAL STATEMENTS
NOTE 20: OPERATING SEGMENTS (Continued)
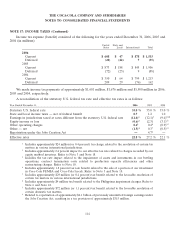
Geographic Data (in millions)
Year Ended December 31, 2006 2005 2004
Net operating revenues:
United States $ 6,662 $ 6,299 $ 6,084
International 17,426 16,805 15,658
Net operating revenues $ 24,088 $ 23,104 $ 21,742
December 31, 2006 2005 2004
Property, plant and equipment—net:
United States $ 2,607 $ 2,309 $ 2,371
International 4,296 3,522 3,720
Property, plant and equipment—net $ 6,903 $ 5,831 $ 6,091
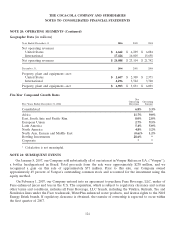
Five-Year Compound Growth Rates
Net
Operating Operating
Five Years Ended December 31, 2006 Revenues Income
Consolidated 6.8% 3.3%
Africa 11.7% 9.0%
East, South Asia and Pacific Rim 8.0% 2.8%
European Union 2.7% 9.5%
Latin America 5.4% 5.0%
North America 4.8% 3.2%
North Asia, Eurasia and Middle East (0.6)% 1.2%
Bottling Investments 28.6% *
Corporate **
* Calculation is not meaningful.
NOTE 21: SUBSEQUENT EVENTS
On January 8, 2007, our Company sold substantially all of our interest in Vonpar Refrescos S.A. (‘‘Vonpar’’),
a bottler headquartered in Brazil. Total proceeds from the sale were approximately $238 million, and we
recognized a gain on this sale of approximately $71 million. Prior to this sale, our Company owned
approximately 49 percent of Vonpar’s outstanding common stock and accounted for the investment using the
equity method.
On February 1, 2007, our Company entered into an agreement to purchase Fuze Beverage, LLC, maker of
Fuze enhanced juices and teas in the U.S. The acquisition, which is subject to regulatory clearance and certain
other terms and conditions, includes all Fuze Beverage, LLC brands, including the Vitalize, Refresh, Tea and
Slenderize lines under the Fuze trademark, WaterPlus enhanced water products, and license rights to the NOS
Energy Drink brands. If regulatory clearance is obtained, the transfer of ownership is expected to occur within
the first quarter of 2007.
124