Coca Cola 2006 Annual Report Download - page 72
Download and view the complete annual report
Please find page 72 of the 2006 Coca Cola annual report below. You can navigate through the pages in the report by either clicking on the pages listed below, or by using the keyword search tool below to find specific information within the annual report.-
 1
1 -
2
-
3
-
4
-
5
-
6
-
7
-
8
-
9
-
10
-
11
-
12
-
13
-
14
-
15
-
16
-
17
-
18
-
19
-
20
-
21
-
22
-
23
-
24
-
25
-
26
-
27
-
28
-
29
-
30
-
31
-
32
-
33
-
34
-
35
-
36
-
37
-
38
-
39
-
40
-
41
-
42
-
43
-
44
-
45
-
46
-
47
-
48
-
49
-
50
-
51
-
52
-
53
-
54
-
55
-
56
-
57
-
58
-
59
-
60
-
61
-
 62
62 -
 63
63 -
 64
64 -
 65
65 -
 66
66 -
 67
67 -
 68
68 -
 69
69 -
 70
70 -
 71
71 -
 72
72 -
 73
73 -
 74
74 -
 75
75 -
 76
76 -
 77
77 -
 78
78 -
 79
79 -
 80
80 -
 81
81 -
 82
82 -
83
-
84
-
85
-
86
-
87
-
88
-
89
-
90
-
91
-
92
-
93
-
94
-
95
-
96
-
97
-
98
-
99
-
100
-
101
-
102
-
103
-
104
-
105
-
106
-
107
-
108
-
109
-
110
-
111
-
112
-
113
-
114
-
115
-
116
-
117
-
118
-
119
-
120
-
121
-
122
-
123
-
124
-
125
-
126
-
127
-
128
-
129
-
130
-
131
-
132
-
133
-
134
-
135
-
136
-
137
-
138
-
139
-
140
-
141
-
142
-
143
-
144
 |
 |

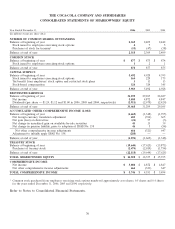
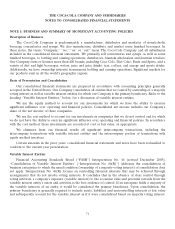
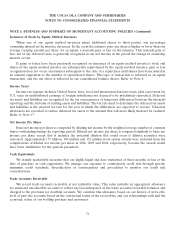
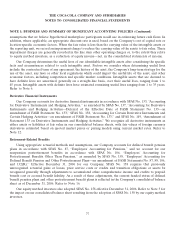
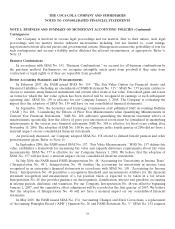
THE COCA-COLA COMPANY AND SUBSIDIARIES
CONSOLIDATED STATEMENTS OF SHAREOWNERS’ EQUITY
Year Ended December 31, 2006 2005 2004
(In millions except per share data)
NUMBER OF COMMON SHARES OUTSTANDING
Balance at beginning of year 2,369 2,409 2,442
Stock issued to employees exercising stock options 475
Purchases of stock for treasury1(55) (47) (38)
Balance at end of year 2,318 2,369 2,409
COMMON STOCK
Balance at beginning of year $ 877 $ 875 $ 874
Stock issued to employees exercising stock options 121
Balance at end of year 878 877 875
CAPITAL SURPLUS
Balance at beginning of year 5,492 4,928 4,395
Stock issued to employees exercising stock options 164 229 175
Tax benefit from employees’ stock option and restricted stock plans 311 13
Stock-based compensation 324 324 345
Balance at end of year 5,983 5,492 4,928
REINVESTED EARNINGS
Balance at beginning of year 31,299 29,105 26,687
Net income 5,080 4,872 4,847
Dividends (per share — $1.24, $1.12 and $1.00 in 2006, 2005 and 2004, respectively) (2,911) (2,678) (2,429)
Balance at end of year 33,468 31,299 29,105
ACCUMULATED OTHER COMPREHENSIVE INCOME (LOSS)
Balance at beginning of year (1,669) (1,348) (1,995)
Net foreign currency translation adjustment 603 (396) 665
Net gain (loss) on derivatives (26) 57 (3)
Net change in unrealized gain on available-for-sale securities 43 13 39
Net change in pension liability, prior to adoption of SFAS No. 158 46 5 (54)
Net other comprehensive income adjustments 666 (321) 647
Adjustment to initially apply SFAS No. 158 (288) ——
Balance at end of year (1,291) (1,669) (1,348)
TREASURY STOCK
Balance at beginning of year (19,644) (17,625) (15,871)
Purchases of treasury stock (2,474) (2,019) (1,754)
Balance at end of year (22,118) (19,644) (17,625)
TOTAL SHAREOWNERS’ EQUITY $ 16,920 $ 16,355 $ 15,935
COMPREHENSIVE INCOME
Net income $ 5,080 $ 4,872 $ 4,847
Net other comprehensive income adjustments 666 (321) 647
TOTAL COMPREHENSIVE INCOME $ 5,746 $ 4,551 $ 5,494
1Common stock purchased from employees exercising stock options numbered approximately zero shares, 0.5 shares and 0.4 shares
for the years ended December 31, 2006, 2005 and 2004, respectively.
Refer to Notes to Consolidated Financial Statements.
70