Coca Cola 2006 Annual Report Download - page 33
Download and view the complete annual report
Please find page 33 of the 2006 Coca Cola annual report below. You can navigate through the pages in the report by either clicking on the pages listed below, or by using the keyword search tool below to find specific information within the annual report.-
 1
1 -
2
-
3
-
4
-
5
-
6
-
7
-
8
-
9
-
10
-
11
-
12
-
13
-
14
-
15
-
16
-
17
-
18
-
19
-
20
-
21
-
22
-
 23
23 -
 24
24 -
 25
25 -
 26
26 -
 27
27 -
 28
28 -
 29
29 -
 30
30 -
 31
31 -
 32
32 -
 33
33 -
 34
34 -
 35
35 -
 36
36 -
 37
37 -
 38
38 -
 39
39 -
 40
40 -
 41
41 -
 42
42 -
 43
43 -
44
-
45
-
46
-
47
-
48
-
49
-
50
-
51
-
52
-
53
-
54
-
55
-
56
-
57
-
58
-
59
-
60
-
61
-
62
-
63
-
64
-
65
-
66
-
67
-
68
-
69
-
70
-
71
-
72
-
73
-
74
-
75
-
76
-
77
-
78
-
79
-
80
-
81
-
82
-
83
-
84
-
85
-
86
-
87
-
88
-
89
-
90
-
91
-
92
-
93
-
94
-
95
-
96
-
97
-
98
-
99
-
100
-
101
-
102
-
103
-
104
-
105
-
106
-
107
-
108
-
109
-
110
-
111
-
112
-
113
-
114
-
115
-
116
-
117
-
118
-
119
-
120
-
121
-
122
-
123
-
124
-
125
-
126
-
127
-
128
-
129
-
130
-
131
-
132
-
133
-
134
-
135
-
136
-
137
-
138
-
139
-
140
-
141
-
142
-
143
-
144
 |
 |

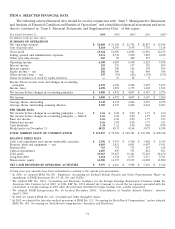
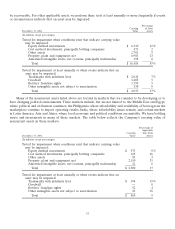
ITEM 6. SELECTED FINANCIAL DATA
The following selected financial data should be read in conjunction with ‘‘Item 7. Management’s Discussion
and Analysis of Financial Condition and Results of Operations’’ and consolidated financial statements and notes
thereto contained in ‘‘Item 8. Financial Statements and Supplementary Data’’ of this report.
Year Ended December 31, 200612005220042,3 2003 20024,5
(In millions except per share data)
SUMMARY OF OPERATIONS
Net operating revenues $ 24,088 $ 23,104 $ 21,742 $ 20,857 $ 19,394
Cost of goods sold 8,164 8,195 7,674 7,776 7,118
Gross profit 15,924 14,909 14,068 13,081 12,276
Selling, general and administrative expenses 9,431 8,739 7,890 7,287 6,818
Other operating charges 185 85 480 573 —
Operating income 6,308 6,085 5,698 5,221 5,458
Interest income 193 235 157 176 209
Interest expense 220 240 196 178 199
Equity income — net 102 680 621 406 384
Other income (loss) — net 195 (93) (82) (138) (353)
Gains on issuances of stock by equity investees —23 24 8 —
Income before income taxes and changes in accounting
principles 6,578 6,690 6,222 5,495 5,499
Income taxes 1,498 1,818 1,375 1,148 1,523
Net income before changes in accounting principles $ 5,080 $ 4,872 $ 4,847 $ 4,347 $ 3,976
Net income $ 5,080 $ 4,872 $ 4,847 $ 4,347 $ 3,050
Average shares outstanding 2,348 2,392 2,426 2,459 2,478
Average shares outstanding assuming dilution 2,350 2,393 2,429 2,462 2,483
PER SHARE DATA
Net income before changes in accounting principles — basic $ 2.16 $ 2.04 $ 2.00 $ 1.77 $ 1.60
Net income before changes in accounting principles — diluted 2.16 2.04 2.00 1.77 1.60
Basic net income 2.16 2.04 2.00 1.77 1.23
Diluted net income 2.16 2.04 2.00 1.77 1.23
Cash dividends 1.24 1.12 1.00 0.88 0.80
Market price on December 31 48.25 40.31 41.64 50.75 43.84
TOTAL MARKET VALUE OF COMMON STOCK $ 111,857 $ 95,504 $ 100,325 $ 123,908 $ 108,328
BALANCE SHEET DATA
Cash, cash equivalents and current marketable securities $ 2,590 $ 4,767 $ 6,768 $ 3,482 $ 2,345
Property, plant and equipment — net 6,903 5,831 6,091 6,097 5,911
Depreciation 763 752 715 667 614
Capital expenditures 1,407 899 755 812 851
Total assets 29,963 29,427 31,441 27,410 24,470
Long-term debt 1,314 1,154 1,157 2,517 2,701
Shareowners’ equity 16,920 16,355 15,935 14,090 11,800
NET CASH PROVIDED BY OPERATING ACTIVITIES $ 5,957 $ 6,423 $ 5,968 $ 5,456 $ 4,742
Certain prior year amounts have been reclassified to conform to the current year presentation.
1In 2006, we adopted SFAS No.158, ‘‘Employers’ Accounting for Defined Benefit Pension and Other Postretirement Plans—an
amendment of FASB Statements No. 87, 88, 106, and 132(R).’’
2We adopted FSP No. 109-2, ‘‘Accounting and Disclosure Guidance for the Foreign Earnings Repatriation Provision within the
American Jobs Creation Act of 2004’’ in 2004. FSP No. 109-2 allowed the Company to record the tax expense associated with the
repatriation of foreign earnings in 2005 when the previously unremitted foreign earnings were actually repatriated.
3We adopted FASB Interpretation No. 46 (revised December 2003), ‘‘Consolidation of Variable Interest Entities,’’ effective
April 2, 2004.
4In 2002, we adopted SFAS No. 142, ‘‘Goodwill and Other Intangible Assets.’’
5In 2002, we adopted the fair value method provisions of SFAS No. 123, ‘‘Accounting for Stock-Based Compensation,’’ and we adopted
SFAS No. 148, ‘‘Accounting for Stock-Based Compensation—Transition and Disclosure.’’
31