Coca Cola 2006 Annual Report Download - page 95
Download and view the complete annual report
Please find page 95 of the 2006 Coca Cola annual report below. You can navigate through the pages in the report by either clicking on the pages listed below, or by using the keyword search tool below to find specific information within the annual report.-
 1
1 -
2
-
3
-
4
-
5
-
6
-
7
-
8
-
9
-
10
-
11
-
12
-
13
-
14
-
15
-
16
-
17
-
18
-
19
-
20
-
21
-
22
-
23
-
24
-
25
-
26
-
27
-
28
-
29
-
30
-
31
-
32
-
33
-
34
-
35
-
36
-
37
-
38
-
39
-
40
-
41
-
42
-
43
-
44
-
45
-
46
-
47
-
48
-
49
-
50
-
51
-
52
-
53
-
54
-
55
-
56
-
57
-
58
-
59
-
60
-
61
-
62
-
63
-
64
-
65
-
66
-
67
-
68
-
69
-
70
-
71
-
72
-
73
-
74
-
75
-
76
-
77
-
78
-
79
-
80
-
81
-
82
-
83
-
84
-
 85
85 -
 86
86 -
 87
87 -
 88
88 -
 89
89 -
 90
90 -
 91
91 -
 92
92 -
 93
93 -
 94
94 -
 95
95 -
 96
96 -
 97
97 -
 98
98 -
 99
99 -
 100
100 -
 101
101 -
 102
102 -
 103
103 -
 104
104 -
 105
105 -
106
-
107
-
108
-
109
-
110
-
111
-
112
-
113
-
114
-
115
-
116
-
117
-
118
-
119
-
120
-
121
-
122
-
123
-
124
-
125
-
126
-
127
-
128
-
129
-
130
-
131
-
132
-
133
-
134
-
135
-
136
-
137
-
138
-
139
-
140
-
141
-
142
-
143
-
144
 |
 |
THE COCA-COLA COMPANY AND SUBSIDIARIES
NOTES TO CONSOLIDATED FINANCIAL STATEMENTS
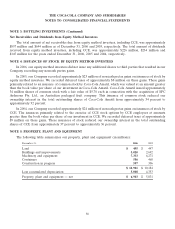
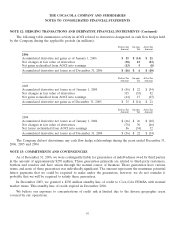
NOTE 11: FINANCIAL INSTRUMENTS (Continued)
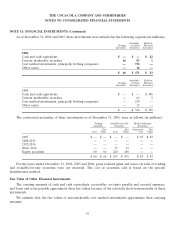
As of December 31, 2006 and 2005, these investments were included in the following captions (in millions):
Available- Held-to-
Trading for-Sale Maturity
Securities Securities Securities
2006
Cash and cash equivalents $— $— $82
Current marketable securities 66 83 1
Cost method investments, principally bottling companies — 372 —
Other assets —16—
$66 $471 $83
Available- Held-to-
Trading for-Sale Maturity
Securities Securities Securities
2005
Cash and cash equivalents $ — $ — $ 346
Current marketable securities — 64 2
Cost method investments, principally bottling companies — 239 —
Other assets — 13 —
$ — $ 316 $ 348
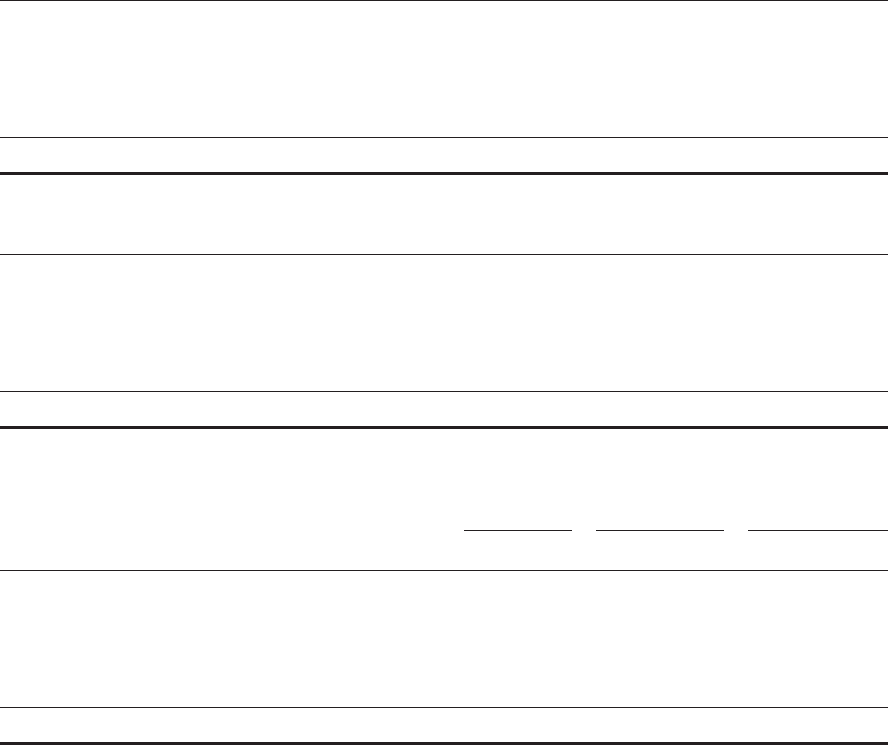
The contractual maturities of these investments as of December 31, 2006, were as follows (in millions):
Trading Available-for-Sale Held-to-Maturity
Securities Securities Securities
Fair Fair Amortized Fair
Cost Value Cost Value Cost Value
2007 $ — $ — $ — $ — $ 83 $ 83
2008-2011 — — — — — —
2012-2016 — — — — — —
After 2016 — — 13 13 — —
Equity securities 60 66 240 458 — —
$ 60 $ 66 $ 253 $ 471 $ 83 $ 83
For the years ended December 31, 2006, 2005 and 2004, gross realized gains and losses on sales of trading
and available-for-sale securities were not material. The cost of securities sold is based on the specific
identification method.
Fair Value of Other Financial Instruments
The carrying amounts of cash and cash equivalents, receivables, accounts payable and accrued expenses,
and loans and notes payable approximate their fair values because of the relatively short-term maturity of these
instruments.
We estimate that the fair values of non-marketable cost method investments approximate their carrying
amounts.
93