Coca Cola 2006 Annual Report Download - page 112
Download and view the complete annual report
Please find page 112 of the 2006 Coca Cola annual report below. You can navigate through the pages in the report by either clicking on the pages listed below, or by using the keyword search tool below to find specific information within the annual report.-
 1
1 -
2
-
3
-
4
-
5
-
6
-
7
-
8
-
9
-
10
-
11
-
12
-
13
-
14
-
15
-
16
-
17
-
18
-
19
-
20
-
21
-
22
-
23
-
24
-
25
-
26
-
27
-
28
-
29
-
30
-
31
-
32
-
33
-
34
-
35
-
36
-
37
-
38
-
39
-
40
-
41
-
42
-
43
-
44
-
45
-
46
-
47
-
48
-
49
-
50
-
51
-
52
-
53
-
54
-
55
-
56
-
57
-
58
-
59
-
60
-
61
-
62
-
63
-
64
-
65
-
66
-
67
-
68
-
69
-
70
-
71
-
72
-
73
-
74
-
75
-
76
-
77
-
78
-
79
-
80
-
81
-
82
-
83
-
84
-
85
-
86
-
87
-
88
-
89
-
90
-
91
-
92
-
93
-
94
-
95
-
96
-
97
-
98
-
99
-
100
-
101
-
 102
102 -
 103
103 -
 104
104 -
 105
105 -
 106
106 -
 107
107 -
 108
108 -
 109
109 -
 110
110 -
 111
111 -
 112
112 -
 113
113 -
 114
114 -
 115
115 -
 116
116 -
 117
117 -
 118
118 -
 119
119 -
 120
120 -
 121
121 -
 122
122 -
123
-
124
-
125
-
126
-
127
-
128
-
129
-
130
-
131
-
132
-
133
-
134
-
135
-
136
-
137
-
138
-
139
-
140
-
141
-
142
-
143
-
144
 |
 |

THE COCA-COLA COMPANY AND SUBSIDIARIES
NOTES TO CONSOLIDATED FINANCIAL STATEMENTS
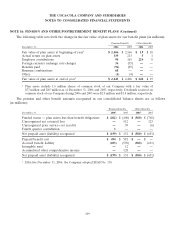
NOTE 16: PENSION AND OTHER POSTRETIREMENT BENEFIT PLANS (Continued)
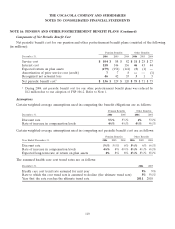
Components of Net Periodic Benefit Cost
Net periodic benefit cost for our pension and other postretirement benefit plans consisted of the following
(in millions):
Pension Benefits Other Benefits
December 31, 2006 2005 2004 2006 2005 2004
Service cost $ 104 $88$82$31$28$27
Interest cost 158 146 136 46 43 44
Expected return on plan assets (179) (154) (141) (5) (1) —
Amortization of prior service cost (credit) 778——(1)
Recognized net actuarial loss 46 42 35 313
Net periodic benefit cost1$ 136 $ 129 $ 120 $75$71$73
1During 2004, net periodic benefit cost for our other postretirement benefit plans was reduced by
$12 million due to our adoption of FSP 106-2. Refer to Note 1.
Assumptions
Certain weighted-average assumptions used in computing the benefit obligations are as follows:
Pension Benefits Other Benefits
December 31, 2006 2005 2006 2005
Discount rate 53⁄4%51⁄2%6% 53⁄4%
Rate of increase in compensation levels 41⁄4%41⁄4%41⁄2%41⁄2%
Certain weighted-average assumptions used in computing net periodic benefit cost are as follows:
Pension Benefits Other Benefits
Year Ended December 31, 2006 2005 2004 2006 2005 2004
Discount rate 51⁄2%51⁄2%6%53⁄4%6% 61⁄4%
Rate of increase in compensation levels 41⁄4%4% 41⁄4%41⁄2%41⁄2%4
1⁄2%
Expected long-term rate of return on plan assets 8% 8% 8% 81⁄2%81⁄2%8
1⁄2%
The assumed health care cost trend rates are as follows:
December 31, 2006 2005
Health care cost trend rate assumed for next year 9% 9%
Rate to which the cost trend rate is assumed to decline (the ultimate trend rate) 5% 51⁄4%
Year that the rate reaches the ultimate trend rate 2011 2010
110