Coca Cola 2006 Annual Report Download - page 50
Download and view the complete annual report
Please find page 50 of the 2006 Coca Cola annual report below. You can navigate through the pages in the report by either clicking on the pages listed below, or by using the keyword search tool below to find specific information within the annual report.-
 1
1 -
2
-
3
-
4
-
5
-
6
-
7
-
8
-
9
-
10
-
11
-
12
-
13
-
14
-
15
-
16
-
17
-
18
-
19
-
20
-
21
-
22
-
23
-
24
-
25
-
26
-
27
-
28
-
29
-
30
-
31
-
32
-
33
-
34
-
35
-
36
-
37
-
38
-
39
-
 40
40 -
 41
41 -
 42
42 -
 43
43 -
 44
44 -
 45
45 -
 46
46 -
 47
47 -
 48
48 -
 49
49 -
 50
50 -
 51
51 -
 52
52 -
 53
53 -
 54
54 -
 55
55 -
 56
56 -
 57
57 -
 58
58 -
 59
59 -
 60
60 -
61
-
62
-
63
-
64
-
65
-
66
-
67
-
68
-
69
-
70
-
71
-
72
-
73
-
74
-
75
-
76
-
77
-
78
-
79
-
80
-
81
-
82
-
83
-
84
-
85
-
86
-
87
-
88
-
89
-
90
-
91
-
92
-
93
-
94
-
95
-
96
-
97
-
98
-
99
-
100
-
101
-
102
-
103
-
104
-
105
-
106
-
107
-
108
-
109
-
110
-
111
-
112
-
113
-
114
-
115
-
116
-
117
-
118
-
119
-
120
-
121
-
122
-
123
-
124
-
125
-
126
-
127
-
128
-
129
-
130
-
131
-
132
-
133
-
134
-
135
-
136
-
137
-
138
-
139
-
140
-
141
-
142
-
143
-
144
 |
 |

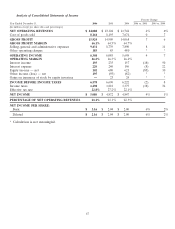
Net Operating Revenues
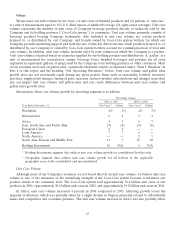
Net operating revenues increased by $984 million or 4 percent in 2006 versus 2005. Net operating revenues
increased by $1,362 million or 6 percent in 2005 versus 2004.
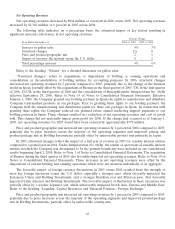
The following table indicates, on a percentage basis, the estimated impact of key factors resulting in
significant increases (decreases) in net operating revenues:
Percent Change
Year Ended December 31, 2006 vs. 2005 2005 vs. 2004
Increase in gallon sales 4% 3%
Structural changes (2) 0
Price and product/geographic mix 2 1
Impact of currency fluctuations versus the U.S. dollar 0 2
Total percentage increase 4% 6%
Refer to the heading ‘‘Volume’’ for a detailed discussion on gallon sales.
‘‘Structural changes’’ refers to acquisitions or dispositions of bottling or canning operations and
consolidation or deconsolidation of bottling entities for accounting purposes. In 2006, structural changes
decreased net operating revenues by 2 percent compared to 2005, primarily due to the change of the business
model in Spain, partially offset by the acquisitions of Bremer in the third quarter of 2005, TJC in the first quarter
of 2006, CCCIL in the third quarter of 2006 and the consolidation of Brucephil under Interpretation No. 46(R)
effective September 29, 2006. Refer to Note 19 of Notes to Consolidated Financial Statements. Effective
January 1, 2006, the Company granted our bottling partners in Spain the rights to manufacture and distribute
Company trademarked products in can packages. Prior to granting these rights to our bottling partners, the
Company held the manufacturing and distribution rights for these can packages in Spain. In connection with
granting these rights, the Company reduced our planned future annual marketing support payments to our
bottling partners in Spain. These changes resulted in a reduction of net operating revenues and cost of goods
sold. This change did not materially impact gross profit for 2006. If the change had occurred as of January 1,
2005, net operating revenues for 2005 would have been reduced by approximately $779 million.
Price and product/geographic mix increased net operating revenues by 2 percent in 2006 compared to 2005,
primarily due to price increases across the majority of the operating segments and improved pricing and
product/package mix in Bottling Investments partially offset by unfavorable product mix primarily in Japan.
In 2005, structural changes reflect the impact of a full year of revenue in 2005 for variable interest entities
compared to a partial year in 2004. Under Interpretation No. 46(R), the results of operations of variable interest
entities in which the Company was determined to be the primary beneficiary were included in our consolidated
results beginning April 2, 2004. Refer to Note 1 of Notes to Consolidated Financial Statements. The acquisition
of Bremer during the third quarter of 2005 also favorably impacted net operating revenues. Refer to Note 19 of
Notes to Consolidated Financial Statements. These increases in net operating revenues were offset by the
dispositions of certain bottling and canning operations which were not material individually or in aggregate.
The favorable impact of foreign currency fluctuations in 2005 versus 2004 resulted from the strength of
most key foreign currencies versus the U.S. dollar, especially a stronger euro, which favorably impacted the
European Union and Bottling Investments, and a stronger Brazilian real and Mexican peso, that favorably
impacted Latin America and Bottling Investments. The favorable impact of fluctuation in these currencies was
partially offset by a weaker Japanese yen, which unfavorably impacted North Asia, Eurasia and Middle East.
Refer to the heading ‘‘Liquidity, Capital Resources and Financial Position—Foreign Exchange.’’
Price and product/geographic mix increased net operating revenues by 1 percent in 2005 compared to 2004,
primarily due to price increases across the majority of the operating segments and improved product/package
mix in Bottling Investments, partially offset by unfavorable country mix.
48