Coca Cola 2006 Annual Report Download - page 124
Download and view the complete annual report
Please find page 124 of the 2006 Coca Cola annual report below. You can navigate through the pages in the report by either clicking on the pages listed below, or by using the keyword search tool below to find specific information within the annual report.-
 1
1 -
2
-
3
-
4
-
5
-
6
-
7
-
8
-
9
-
10
-
11
-
12
-
13
-
14
-
15
-
16
-
17
-
18
-
19
-
20
-
21
-
22
-
23
-
24
-
25
-
26
-
27
-
28
-
29
-
30
-
31
-
32
-
33
-
34
-
35
-
36
-
37
-
38
-
39
-
40
-
41
-
42
-
43
-
44
-
45
-
46
-
47
-
48
-
49
-
50
-
51
-
52
-
53
-
54
-
55
-
56
-
57
-
58
-
59
-
60
-
61
-
62
-
63
-
64
-
65
-
66
-
67
-
68
-
69
-
70
-
71
-
72
-
73
-
74
-
75
-
76
-
77
-
78
-
79
-
80
-
81
-
82
-
83
-
84
-
85
-
86
-
87
-
88
-
89
-
90
-
91
-
92
-
93
-
94
-
95
-
96
-
97
-
98
-
99
-
100
-
101
-
102
-
103
-
104
-
105
-
106
-
107
-
108
-
109
-
110
-
111
-
112
-
113
-
 114
114 -
 115
115 -
 116
116 -
 117
117 -
 118
118 -
 119
119 -
 120
120 -
 121
121 -
 122
122 -
 123
123 -
 124
124 -
 125
125 -
 126
126 -
 127
127 -
 128
128 -
 129
129 -
 130
130 -
 131
131 -
 132
132 -
 133
133 -
 134
134 -
135
-
136
-
137
-
138
-
139
-
140
-
141
-
142
-
143
-
144
 |
 |

THE COCA-COLA COMPANY AND SUBSIDIARIES
NOTES TO CONSOLIDATED FINANCIAL STATEMENTS
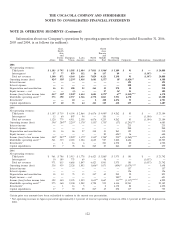
NOTE 20: OPERATING SEGMENTS (Continued)
Information about our Company’s operations by operating segment for the years ended December 31, 2006,
2005 and 2004, is as follows (in millions):
East, North
South Asia,
Asia Eurasia
and and
Pacific European Latin North Middle Bottling
Africa Rim Union America America East Investments Corporate Eliminations Consolidated
2006
Net operating revenues:
Third party $ 1,103 $ 795 $ 3,505 $ 2,484 $ 7,013 $ 3,9861$ 5,109 $ 93 $ — $ 24,088
Intersegment 37 77 859 132 16 137 89 — (1,347) —
Total net revenues 1,140 872 4,364 2,616 7,029 4,123 5,198 93 (1,347) 24,088
Operating income (loss) 424235822,25421,438 1,683 1,5572182(1,424)2,3 — 6,308
Interest income — — — — — — — 193 — 193
Interest expense — — — — — — — 220 — 220
Depreciation and amortization 16 13 100 25 361 55 278 90 — 938
Equity income — net — — (4) — — 27 56623 — 102
Income (loss) before income taxes 413235822,25821,434 1,681 1,5792672,6 (1,212)2,3,4 — 6,578
Identifiable operating assets5,7 573 390 2,557 1,516 4,778 1,043 5,953 6,370 — 23,180
Investments8— — 24 — 2 428 6,276 53 — 6,783
Capital expenditures 37 10 93 44 421 129 418 255 — 1,407
2005
Net operating revenues:
Third party $ 1,107 $ 719 $ 4,104 $ 2,064 $ 6,676 $ 4,0891$ 4,262 $ 83 $ — $ 23,104
Intersegment 13 60 807 94 — 130 — — (1,104) —
Total net revenues 1,120 779 4,911 2,158 6,676 4,219 4,262 83 (1,104) 23,104
Operating income (loss) 39692849,10 2,21991,17691,55391,7359(37) (1,241)9,11 — 6,085
Interest income — — — — — — — 235 — 235
Interest expense — — — — — — — 240 — 240
Depreciation and amortization 18 16 86 27 348 43 265 129 — 932
Equity income — net — — — — — 20 62412 36 — 680
Income (loss) before income taxes 38292839,10 2,22591,17591,54991,748959012 (1,262)9,11,13 — 6,690
Identifiable operating assets5,7 561 339 2,183 1,324 4,645 987 3,842 8,624 — 22,505
Investments8— 1 16 6 — 281 6,538 80 — 6,922
Capital expenditures 23 7 78 24 265 89 264 149 — 899
2004
Net operating revenues:
Third party $ 961 $ 706 $ 3,913 $ 1,778 $ 6,423 $ 3,8851$ 3,975 $ 101 $ — $ 21,742
Intersegment 10 109 773 69 — 96 — — (1,057) —
Total net revenues 971 815 4,686 1,847 6,423 3,981 3,975 101 (1,057) 21,742
Operating income (loss) 336 439 2,126 1,053 1,60614 1,671 (454)14 (1,079)14,15 — 5,698
Interest income — — — — — — — 157 — 157
Interest expense — — — — — — — 196 — 196
Depreciation and amortization 18 14 75 33 347 69 245 92 — 893
Equity income — net — — — — — — 58016 41 — 621
Income (loss) before income taxes 322 440 2,125 1,059 1,61514 1,667 13114,16 (1,137)14,15,17 — 6,222
Identifiable operating assets5,7 575 360 2,300 1,202 4,728 939 4,144 10,941 — 25,189
Investments8— 1 16 5 — 8 6,138 84 — 6,252
Capital expenditures 17 7 39 25 247 45 258 117 — 755
Certain prior year amounts have been reclassified to conform to the current year presentation.
1Net operating revenues in Japan represented approximately 11 percent of total net operating revenues in 2006, 13 percent in 2005 and 14 percent in
2004.
122